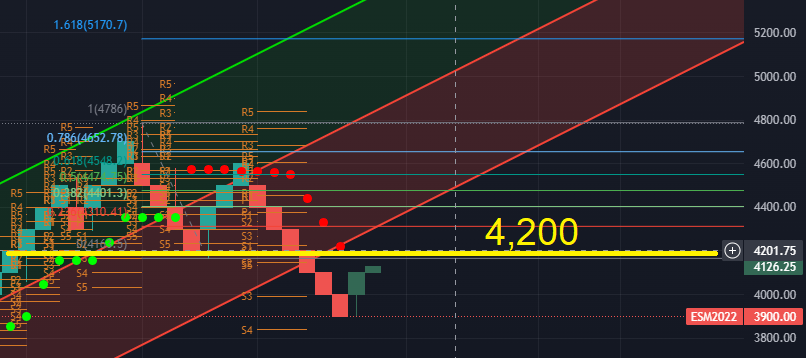
- We stated on May 26th to be a seller at 4,150/75 in the S&P 500 (futures), the high yesterday was 4,199.
- We stated on May 26th to be a seller at 13,000 in the NASDAQ (futures), the high yesterday was 12,868. Slightly off our reduce risk level.
- Jamie Dimon turns negative, stating the economy is heading for a “hurricane” vs. his previous statement of “storm clouds” were on the horizon two weeks ago.
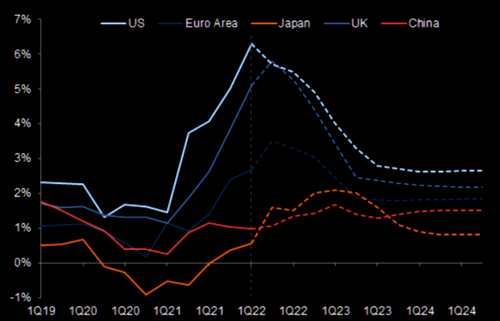
- Markets, especially rates starting to price in a slower easing policy trajectory as economic condictiones collapsed over the last several weeks. The market actually priced in a cut for Dec 2023 as the markets saw weaker economic conditions. HOWEVER, the Feds Bostic through a wrench in that theory, as he said a September “pause was not likely. Remember, we discussed the market went from a 80% chance of a .75% cut in September two weeks ago to less than 40% last week. Market got a little over Overzealous on the path. This in my view was the most bearish event for risk assets today!!
- Then you had ISM showing that (hotter) pricing pressures continue as PMI signaled stagflation as new orders slowed with continued.
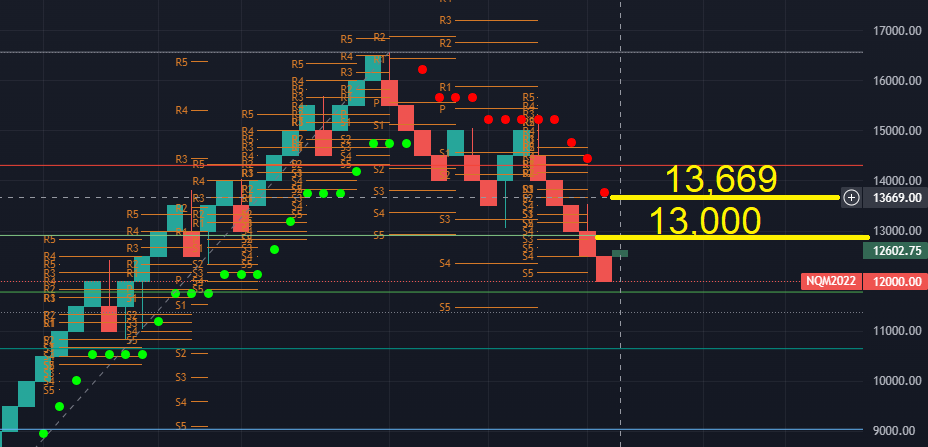
- NASDAQ futures: 12,900/12,999. I am not saying we will get there, however, it will not take much. This is a level, where I would reduce technology.
- S&P 500 futures: We could easily rally back to 4,170, no issue based on the S&P 500 blended model with a -58 reading. Which I would reduce exposure to anything that is economically sensitive like financials and materials.
The Fed & Wed Rally
The equity positioning yesterday was set up for a rally as shorts covered as the Fed reduced the possibly of a .75bps rate hike for June. Even though it was a low probability the markets started to price in late last week a possibly for .75%. What caused yesterday rally once again was your typical gamma squeeze caused by positioning. Powell in our opinion was buying time and was weak on inflation yesterday as we can only assume the Fed hopes (prays) that the data will improve before killing economic output. Maybe he knows how CPI will look next week??
Thursdays sell off
In my opinion Thursdays sell off was because Powell lost a lot of credibility and the market realized he will need to be more aggressive than letting on. Where did he lose credibility? Well the fact he had no clear rational why he was starting the roll off the balance sheet on June 1st when they were suppose to start in April. He had no clear process that really was a loss of credibility to me.
- S&P 500 (Futures)
- We said late January that it seemed probable that our S&P 500 model (seen below) could reach a -51, which would take the index to 4,125. February 24th the S&P 500 (futures) hit a low of 4,102.
- We said a -51 reading on our model would be a typical correction and cause a counter trend rally taking the S&P 500 back to 4,548. Today the index closed at 4,534.
- We said the S&P 500 would not fail and revert lower from the -41 reading as it increased to -33 until it moved well above 0. Currently the model has a reading of 15 reading.
- We said the S&P 500 was much more constructive than the NASDAQ and we currently favor the S&P 500 over the NASDAQ, especially the equal weight S&P 500.

- NASDAQ (Futures)
- We said early March that a pre-market gap down on the NASDAQ futures to 12,900 would cause a large counter trend reversal to 14,330.
- On March 15th the NASDAQ did gap down to 12,958 and in just 4 days rallied to our first target of 14,330.
- We said we would reduce growth exposure once the NASDAQ reached 14,330 and 14,900 respectively. Today the NASDAQ closed at 14,841.
- Even though April is seasonally a strong period, we believe the NASDAQ will retest 14,175 and potentially much lower.

Financial Sector
- The NIM (net interest margin) expansion easy money rally which started last May is over. Regardless of the shortest part of the curve the 3 month to 10 year yield being steep, the 2/10 inversion is what really matters, don’t be fooled. The 3/10’s is not what is in play here. Even if rates rise slightly more within an inverse curve, the Fed needs to slow growth and that ultimately causes 2 things that will hurt banks, 1.) An increase in loan loss reverses from a weaker economic activity and 2.) slower loan growth. Don’t believe all rising rate environments work blindly for financials. Bottomline, if you are going to play this sector you better know your stocks and not blindly own XLF.
- Now that every is talking about the inversion of the 2/10’s, we included as in yesterday’s email, we wanted to opine on a few things.
- Stats can be dangerous if not used in the proper context. While historically as seen below, an inversion on the Yield Curve doe not significantly impact the S&P 500. In fact the following 3 and 6 months on average equities are positive.
- However, seen in the second chart only 1 out of 8 times has the S&P 500 multiple been higher than today during a tightening cycle. Only in 1999 was the Case-schiller PE higher than today. We prefer looking at the Case-schiller PE as it is an average inflation-adjusted earnings from the previous 10 years vs traditional PE ratios.
- Lastly, none of these periods had CPI prints as high as we currently do caused by monetary and fiscal stimulus.
- This time is truly different!!


Many Fed watchers are now say after the Fed minutes revised language that the Fed has three more 50bps hikes and the Fed is done and the next move will be a cut a economic growth recesses. If the market starts to price this in we will see a massive late 2022 rally. We will see!
June 18th
A lot to go over here as things are starting to get very interesting.
- Wednesday kicked off an outlier when the Fed committee now sees 1 rate high in 2022 and potentially a discussion of tapering bond purchases at Jackson Hole. This for obvious reasons sparked a unwind of the reinflation trade. Which after 10 months can have even more to go on the downside i.e. energy, materials, financials. The discussion of possibly tapering sent yields down on the long end as this will reduce growth forecasts as well. However, the short end of the curve remained rather stable. This caused the 2/10 yield curve to almost flattened completely destroying the banks.
- Yields took another dive on Friday after Fed’s Bullard said the discussion of tapering is on the table and he is concerned of a housing bubble.
- The 10 year yield needs to hold 1.38% or the reinflation sectors financials, energy and materials are going to unwind. As we have been discussing for the last 4 weeks, we thought 1.38% was possible and this is where we would look to reduce technology.
- We also said 14,215 on the NASDAQ was another level we would be looking to reduce technology.
- We also have been saying that the consensus would be wrong on inflation and now that seems to be correct for now.
- The S&P 500 seems like there is more downside if rates keep on this current path. We did say reducing S&P 500 exposure at a 91 reading seemed to be warranted.
- I can almost see the S&P 500 correcting to 4,000 to 4,050 and then the Fed steps in walking back their hawkish stance on tapering to support equity prices.
- I certainly would not be adding to the growth trade (NASDAQ) names now after this massive reinflation unwind. I think before we know it, it will be time to start reallocating back to the reinflation trade after another leg lower on the 10 Year Yield.
- I am not a buyer of anything yet.
June 16th
Premarket we had a lot of data that should come as no surprise. The less important inflation gauge of Producer Prices rocketed to 6.6% year over year in May the fastest pace on record. This had little impact on rates, as an .80bps increase in the 10 -Year Yield couldn’t hold and the 10 Year closed flat. Retail sales declined 1.3% after last months weaker than expected number. It seems as though the consumer pent up demand might be waning after stimulus has run its course.
In our June 2nd commentary we highlighted commodities and the case of transitory inflation, stating, Does the recent run up in Commodity prices represent true fundamental (inflationary) demand or simply a function of supply chain shortages? When investors push up Commodity prices based on anticipation of higher inflation this could be deemed non-fundamental longer term inflation and more transitory.
If we just looked at Lumber Futures and Cooper, this would possibly be a signal that recent higher inflation is transitory as these markets have and starting to mean revert. Lumber broke its Vol stop on May 14th the same time the 10 year started to see significant resistance. Cooper certainly a better market signal, however, Lumber did stared to break first. 
Many signals seem to be signaling inflation will be transitory. Again consensus is that a new Super Cycle is underway. In our opinion consensus does not create Alpha.
Tomorrow we have the main event and our play book from yesterday is know longer in effect as energy rallied and tech failed to reach 14,215.
S&P 500 model
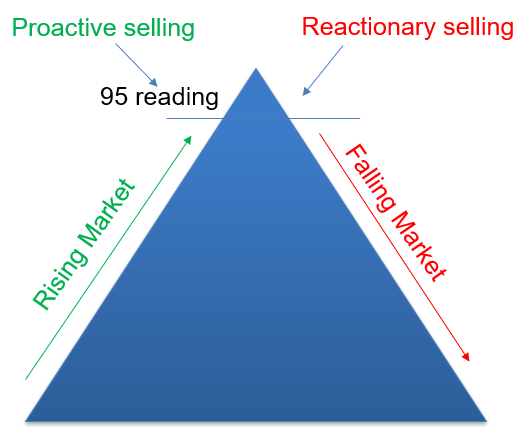
Our S&P 500 model is now at about a 91. As we know we like to reduce risk as the model gets close to the 95 reading. However, a 95 would be another 2.5% to 3% higher from here. Reducing exposure prior to 95 maybe warranted as there is no certainly 95 will be achieved.
June 14th
Back on May 19th we stated: “something unusual is happening and I don’t know if it is the start of a new trend. However, the 10-Year Yield jumped 2.50% today as the NASDAQ was exceptionally strong yet reinflation sectors energy, materials, and con. cyclicals were crushed. While I cant provide a hard factual explanation. I do believe the market is sensing growth is slowing and the stimulus effects will decline both in terms of growth and inflation and thus sell reopening stocks and get long tech as rates go lower in the second half of the year”.
- Banks were exceptionally weak as the 10 Year Yield rose 3%. I discount the weakness slightly as JPMorgan said today trading revenue would be lighter in the second half.
- However, regional banks that derive all their income from loans and fees and not FIC trading were down as much as the money center banks. Even the insurers were down as much as the money centers.
- The move today in financials was not in my opinion a result off the back of JPM’s comments. Conversely, Materials, Industrial and Energy as well the Russell / reinflation trade were sold hard.
- The consensus believes the Fed will not change its messaging and not entertain the question of tapering. However. everyone knows the Fed is stuck in a corner, even my 11 year old knows this. Powell will keep moving hit goal post, he doesn’t want a market collapse on this term. We will see what happens in Sept when extended unemployment benefits end and boost the jobs numbers in Oct. But until then, he won’t disrupt the waters.
- Macro traders therefor are trying to get ahead and have for weeks ahead of Wednesday Fed’s meeting.
- Many believe this would cause a clear run way for the growth heavy NASDAQ to run further.
- As mentioned, on June 10th we were looking for 14,215 on the NASDAQ futures to reduce long exposure. If the index does reach this level prior to the Fed on Wed, I expected to see a reversal on the NASDAQ late Wednesday or Thursday as almost sell the Fed statement regardless as positioning already took advantage of this setup. Furthermore, a possible small counter trend rally back into Materials and Energy maybe Financials would bee likely if these sectors see further weakness tomorrow.
Today we had the fastest CPI increase since 1992. The increase came once again from the same inputs, housing and autos. The market reaction is seeming to be transitory as the 10 Year Yield reversed to the downside 2.50% now flat. The bottom-line is that the bond market was still heavily shorted and now bonds are no longer oversold. In summary, 14,000 and 14,200 on the NASDAQ futures are levels reducing tech exposure would be warranted as I do not believe the 10 Year yield will break below key support of 1.37%

The Great Debate – Inflation
The consensus on Wall Street is inflation will be the driving factor and catalyst for the Fed to taper. The question all investors are debating is whether or not this current spike in inflation is transitory. Some investors do feel that the Reverse Repo market can be another reason the Fed might need to taper sooner rather than later as banks have nowhere to put all their excess cash. The REPO market ended the month at its highest level ever.
We aren’t trying to answer the question of when the Fed will taper or if inflation will be transitory. However, traditionally when the consensus is so heavily weighted to one side, rarely does the consensus get it right. Below we highlight a few data points from May, which could be suggesting growth will slow in the later half of the year, which could cause the blockbuster inflation prints to be transitory. If this were to be the case, the eight month regime change of early cycle re-inflation (value) trade could transition back to mid cycle higher growth sectors.
May’s Inflation and Growth Takeaways:
- CPI: May saw CPI break above its long term trend coming in exceptionally hot at 4.20% vs. its expected 3.75%, driven predominantly from new/used cars and housing. However, the treasury market was completely unfazed and yields reverted lower. This reaction by the treasury market could be a sign that it believes inflation could wain.
- Core PCE Deflator soared 3.1% YoY, the hottest print since May 1992. However, Yields that day fell 1.34% after the print, disregarding the Feds key inflation data point. Once again this reaction by the treasury market could be a sign that it believes inflation could wain.
- Treasury Yields: Treasury Yields did not break out of their range. As we mentioned last month, the 10 Year Yield would remain range bound for the short term as bonds remained oversold and it would take a significantly negative catalyst for yields to break above 1.77% on the 10-Year Yield. The 10 -Year Yield opened the month of May at 1.68% to close lower at 1.60%. Our opinion is the markets could be forecasting a slow down in growth in the later part of the year as stimulus dissipates and extended unemployment benefits stop in September.
- Transitory: The question every investor is trying to forecast is: Will inflation be transitory or not? Interestingly enough Fed Vice Chair Richard Clarida stated one week after the massive CPI print that the Fed has not reached its inflation target. Shortly after Clarida’s remarks Jerome Powell said he was not happy with the economic progress. This begs the question will the Fed be late to taper. The markets are certainly behaving as though inflation will be transitory.
- Autos: Autos lead the CPI hotter than expected number to 4.20% above trend. However, the market shortly seemed to have discounted this negative macro event. This supply/demand imbalance does seem transitory, possibly a result of the lack of supply from the semiconductor bottleneck. As this bottleneck opens up, potentially in Q4, this could cool CPI as more supply will come back on-line.
- Wages: Wage inflation also started to creep into the market in May as companies like Chipotle, Amazon and McDonalds could not find workers to return to work, potentially exacerbated by both the state and Federal unemployment benefits packages. Many of these companies are increasing wages, but also paying job applicants to interview. However, the market seems to be sensing that wage inflation will not be an issue once the extended unemployment benefits run out in September. Corporations will find it easier to hire, as many individuals will return to work.
- Growth: In previous quarters consumer spending did fade slightly after both rounds of stimulus checks. One outlier to be considered: Will the massive $2 trillion in consumer savings during the pandemic be powerful enough to cause longer term inflationary pressures. We doubt this is the case, but will monitor the issue.
- Re-inflation Trade: We also saw in the last 10 trading days of May the re-inflation early cycle sectors under-perform. Sectors like materials, industrials and financials underperformed as yields in the mid and long end of the curve declined.
- Homes: New home sales had a significant decline in May as home prices had their fastest increase in prices since 2013. This certainly will cause some deflationary pressure if buyers continue to go on strike and wait for pricing to become more affordable. We assume this will ultimately happen with many other goods like Autos and Consumer Goods. The market seems to be anticipating this deceleration could put a lid on growth.
- Commodities: Lastly, below we have the S&P 500 Goldman Sachs Commodity Index that significantly broke out of a 11 year downward trend. Commodity trends typically are longer in nature than equity trends and breaking out of a 11 year down trend can be very powerful and prolonged. Does the recent run up in Commodity prices represent true fundamental (inflationary) demand or simply a function of supply chain shortages? When investors push up Commodity prices based on anticipation of higher inflation this could be deemed non-fundamental longer term inflation and more transitory.

June 4th
Not much has changed regarding our May 14th post stating.
- S&P 500: I find it likely at this juncture the S&P 500 will retest its all time highs of 4,230.
- NASDAQ: likely probability 13,630, and once again I would be selling into this level if you bought any tech on the recent weakness.
Today the S&P 500 futures did hit 4,232, while the NASDAQ futures did close above 13,600 at 13,760. We did say on numerous occasions, 14,000 seems likely.
Today we had bad news that was received very positively because once again that will push out taper talks by the Fed. The jobs number missed by 100,000 jobs, but the whisper was really about a 500,000 miss as the market was looking for 1 million new jobs. This weaker than expected number sent the 10 Year Yield down 4.30% to 1.555%.
In September many extended unemployment benefits will expire and those who are earning less than $32,000 a year will be forced back into the labor market. This will cause an significant increase in new jobs added and will spark rates to significantly increase. Thus I am still a seller of technology as the NASDAQ reaches 14,000.
Next stop to reduce equity exposure for the S&P 500 is 4,300.
May 25th
Now we are starting to really see our theory of lower growth less inflation play out. I do think the market as previously stated is seeing slower growth as Biden’s stimulus comes to an end and the extended unemployment benefits run out in Sept and Oct.
The evidence:
1. Real rates are down significantly since CPI, the 10-Year Yield is 1.567% today after the strongest 2 year auction in 2021 and in the last years. If bond investors were fearful of higher longer term inflation, why would the 2 year auction have been the strongest in almost a year.
2. Energy, materials and financials look very weak as technology continues to catch a bid.
3. New home sales had a significant decline as homes prices had their fast increase since 2013, this will cause some deflationary pressures until prices become more affordable. We will see this with Auto’s and consumer goods. All deflationary.
4. The market senses the consumer will not be able to keep bidding up prices as stimulus benefits start to dry up and the extended unemployment benefits come to an end. All seemingly better for technology as yields could move much lower.
5. I am cautious on consumer discretionary, materials, energy and even financials.
May 24th
As we pointed out last week, there seemed to be a new trend developing where technology could lead as reinflationary, early cycle sectors like energy, financials and materials would lag because the market is forecasting growth slowing in the back half of the year. Weather or not this theory is correct, we wont know for many months.
So far this trend has been 3 out of 4 days, so not much of a trend yet. As we discussed, this is possibly as a result of slower growth and possibly the market discounting inflation as transitory. Deflationary risk are real as every investor is in the camp inflation is going to continue. After the 4.20% CPI print the 10 Year Yield is actually down. The consensus is rarely right, as there are no good market forecasters.
Additionally, the NASDAQ took out a big level of 13,630 today on the back of China trying to cool inflation as their credit impulse number went negative. This is deflationary and inversely correlated to global technology as rates decline.
- If this current level on the NASDAQ of 13,630 holds, the index could retest 14,100.
- As for the S&P 500 nothing has changed in our view from last week, we were looking for new all time highs. Today the index closed at 4,200, so we are only 38 points away from the all time highs.
- Feds Bullard was out saying the Fed is not ready to discuss tapering. It will never be ready, The Fed has no choice but to let this bubble continue or risk a market failure. So far they have done a good job in talking down yields from breaking out since February’s move.
May 20th
Yesterday we pointed out, “something unusual is happening and I don’t know if it is the start of a new trend. However, the 10-Year Yield jumped 2.50% today as the NASDAQ was exceptionally strong yet reinflation sectors energy, materials, and con. cyclicals were crushed. While I cant provide a hard factual explanation. I do believe the market is sensing growth is slowing and the stimulus effects will decline both in terms of growth and inflation and thus sell reopening stocks and get long tech as rates go lower in the second half of the year”.
Today that trend has continued as reopening and reinflation trades were red versus a strong rally in growth, especially technology. Now this could be the narrative as mentioned yesterday that the market is forecasting economic growth to slow, putting pressure on yields, thus this would potentially get the NASDAQ back to 14,000. Last week I did say I thought the S&P 500 would retest its highs and still believe that. Here are a few reasons to be a little more bullish.
- The market was extremely overbought on the S&P 500 level and could not correct to last weeks lows or the typical 7% from the 96 blended S&P 500 reading… Bullish
- The market had some big macro shocks like last weeks massive inflation risk that it completely disregarded… Bullish
- Hedge funds are the most net short in 5 years technology, everyone is positioned for risk off on the buy-side…Bullish
- Tomorrow is a big options expiration day and could take see some downward pressure.
May 19th
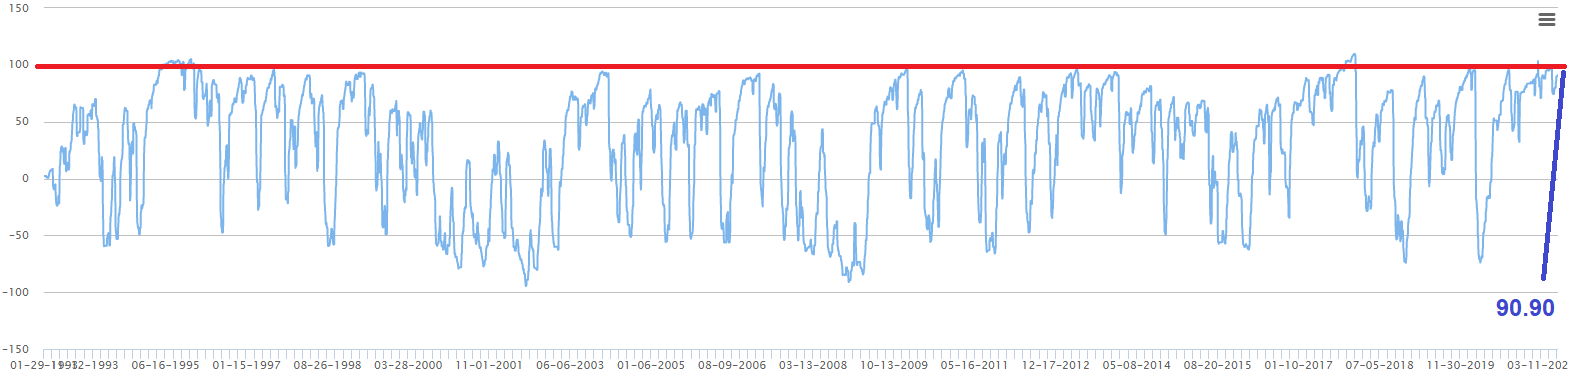
Market participants can pontificate on today’s market weakness. Although, as we always say, there will always be a new narrative when markets are overbought and find a reason to sell off. I have been in the camp for well over a year that the Fed’s policies has caused excessive expansion in multiples. This is not a theory, its a fact as equity risk premiums are the second lowest ever next to 1999 as seen below. Unfortunately the Fed is making investors take extra risk. We discussed this two weeks ago with this chart below. We all keep playing the game knowing the risks of extremely low equity risk premiums (S&P 500 Yield / Risk Free Rate 10 Year) are eventually going to cause a lot of pain. However, when does it end, being in all cash can be a real liability.
My point is what is the game changer yesterday or today to make equity risk premiums reverse higher to a more normalize levels. Nothing. Not yet at least. However, when they do normalize multiples will be squeezed. The Fed knows this very well. They know once they stop the $120 billion monthly CMS and other bond purchases along with communicating more taper talk, the market is done.
Today’s Fed minutes was not remotely a game changer, they really said nothing except Kaplan wants to start the taper discussion sooner than later. Fed Chairman Powell knows he needs to keep the market up at all costs. That is why he keeps saying he is not happy with the economic progress. He needs to talk down the markets expectations of tapering.
Furthermore, unrelated to the Fed, something unusual is happening and I don’t know if it is the start of a new trend. However, the 10-Year Yield jumped 2.50% today as the NASDAQ was exceptionally strong yet reinflation sectors energy, materials, and .con cyclicals were crushed. While I cant provide an hard factual explanation. I do believe the market is sensing growth and is slowing, stimulus effects will decline and thus sell reopening stocks and get long tech as rates go lower in the second half of the year.
Bottom-line today in my opinion was not a game changer for the big correction. BitCON caused liquidations in other areas of the market and once BitCON rallied back the market stabilized.
May 18th Market Commentary
The last two days have been slow, but the price action has been terrible. I strongly dislike the type of BS artificial rallies we got last Thursday and Friday as a result of short covering. According to Goldman Sachs Prime brokerage, their Hedge Fund Clients are the most net short the technology sector in 5 years. That certainly can explain for the massive reversal last Thursday and Friday and lack of a bid in the last 2 days.
I do not like the lack of participation in the S&P 500, its starting to get narrow. What I am currently watching for in terms of breadth is the Strong Buy to Strong Sell Ratio. We are starting to see the Strong Buys decline and Strong Sells increase. We will have to wait to see where these two lines stop, if not converge. 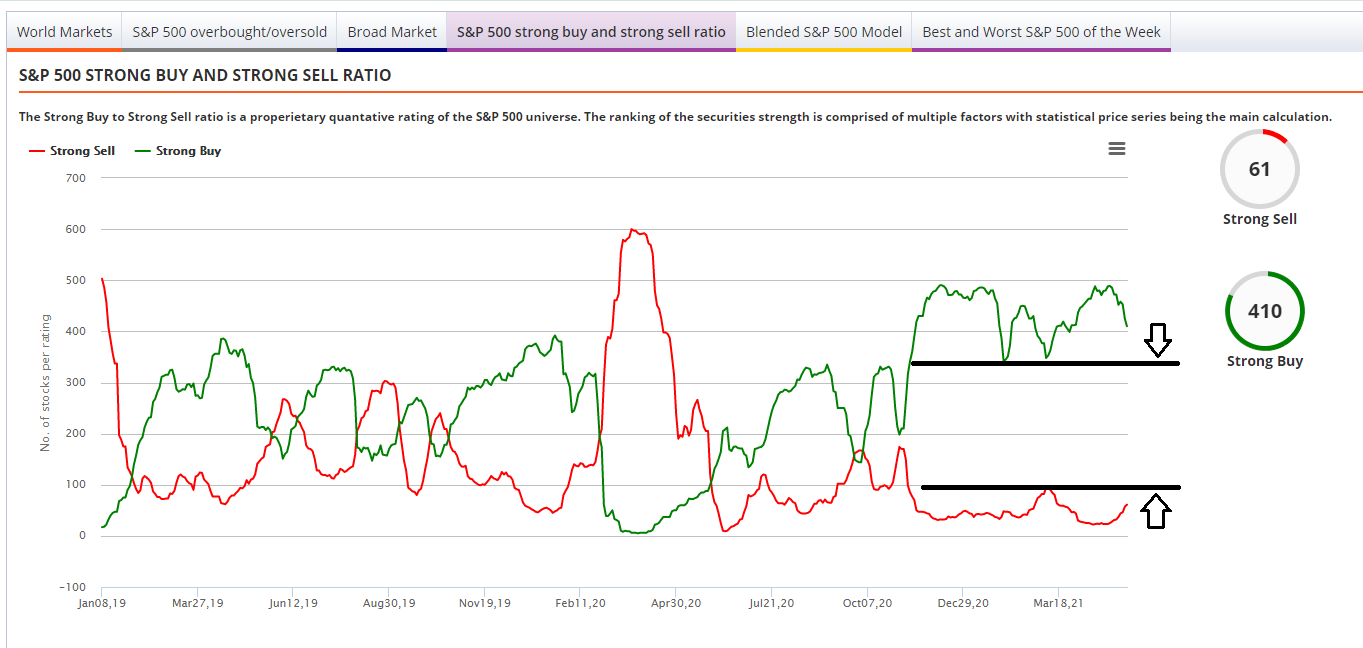
Market 14th
The strength within the NASDAQ on Wednesday told the story, too much liquidity to take this market down, not even inflation astonishingly can cause more than a 4% correction on the S&P 500.
We said we wanted to get long for short term trade on the NASDAQ futures at 12,700, but that was wishful thinking as the index only traded to 12,896. Furthermore we said getting long the S&P 500 around 3,970 seemed constructive, however the index only reached 4,025.
Today in my opinion was a lot of short covering once again and a rally spark by bad news is good news. Retail sales completely missed expectations, which reduced fears of higher inflation and just maybe the recent inflation is transitory from the fiscal stimulus checks. Which in my belief spells stagflation. For those who don’t think retail sales is that important its, vital as 3/4 of GDP is consumer spending. Bottom-line, we won’t know if inflation is transitory for months to come.
As I have mentioned several times, maybe this liquidity is just too much of a force and has completely backstopped all risk in the market. I can’t begin to tell you have many institutional investors and hedge funds that say the market and fundamentals are completely broken from reality. Something you would never hear on CNBC or the main street banks as they don’t get paid fees to sit in cash
Today was nothing more than machine taking out levels. Once short term levels are taken out they keep bidding to the next level until we get to medium term resistance, this is something that has become more and more prevalent on days of short covering. Between all the excess liquidity the dominance of passive investing and 90% of the intra day volume from non humans. The market is know longer the market you once knew that reflects true price discovery.
S&P 500: I find it likely at this juncture the S&P 500 will retest its all time highs of 4,230.
NASDAQ: likely probability 13,630, and once again I would be selling into this level if you bought any tech on the recent weakness.
May 12th Post Market
Not to much to elaborate upon our morning comments.
- I think the NASDAQ showed a lot of strength today, yes that sounds ridiculous, but it refused to break the 12,950 level we have been discussing. The NASDAQ futures hit a low today of 12,959, only 9 points from our target level. However, I am still not a buyer of technology yet.
- Short term intraday: If the NASDAQ had a large gap down tomorrow to 12,700, I would be buying only for a short term intra day trade.
- Long-term investors: I am not excited about the set up and will be taking our lead once rates either retest 1.77% and fail or breakout to 2%.
- Both scenarios above are very different set ups.
The S&P 500 on the other hand actually had some damage done as it close below the 4,080 level we discussed. Not even financials and energy the two best sectors for rising inflation and rates could remain positive. The next major support area is 3,970, which might be very constructive to start averaging in. This level needs to hold, or 3,895 is the big test level. We will have to wait and see for a game time decision.
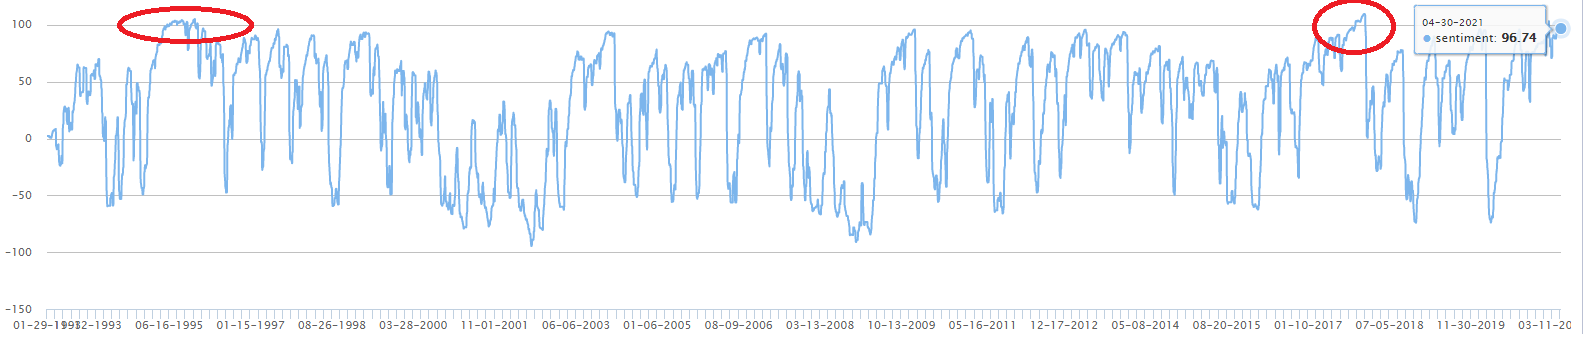
We hope that know one jumped the gun trying to buy the dip as we discussed hundreds of times before the risk to reward with the blended S&P 500 model reading 96.70 is not worth adding to longs. We can not call bottoms, nor will we try. All we are attempting to do is wait for less risk in the market to deploy capital to high quality names in sectors that are strong.
May 12th Pre Market
What did we learn today from today CPI, nothing new really. I actually think the market is reacting very well, but the close is what will determine the truth.
- NASDAQ: Yesterday we said with a hotter than expected number the NASDAQ would test 13,060, the low so far was 13,036. It really doesn’t matter anyway, because it shouldn’t be bought anyway. The time to buy the NASDAQ is once we get the next major breakout of Yields, If yields do break above 1.77% and test 2% and this is a big IF, because bonds are still oversold, that will be the time to start reallocating to technology.
- S&P 500 took out 4,109 we discussed and needs to 4,080.
- Again the S&P 500 model was a a massively overbought level of 96.70, it would be very typical for the S&P 500 to pullback to 3,950 to complete a garden variety correction.
As we can see form the graph from yesterday, CPI blew right through the trended forecast.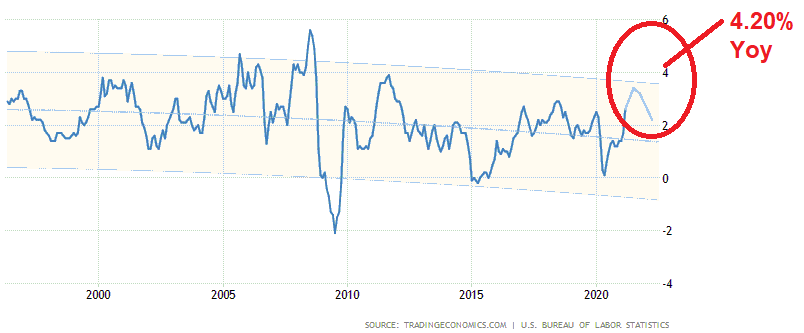
What could save the market is if Powell comes out within the next day or so and reassure the markets this is 100% transitory. Powell needs to say that today’s CPI jump is not going to be the start of a new bigger trend of inflation.
We will be back after the close.
May 11th The Close
Not even inflation is a match for the massive liquidity.
Massive reversal in the NASDAQ and bid hard right at the the market open, almost 300 points from premarket. The market liquidity is just too much for a plan vanilla 10% correction. More and more companies are raising wages as they cant find workers. This is extremely bad for the S&P 500 earnings because it is less elastic than the NASDAQ as many of the companies are consumer cyclicals and staples. These companies have a harder time passing on these extra costs before buyers reduce spending. Wage increase will certainly hit the income sheet of these companies.
- S&P 500: I remain neutral on the S&P 500 here. We stated this morning the S&P 500 had a lot of support at 4,109, the index tested 4,104. However, the index was weaker relative to the NASDAQ as did buyers couldn’t help themselves as there is just too much liquidity for an old school 10% pullback.
- NASDAQ: I am not as neutral on the NASDAQ and do think its going to cause more pain than financial happiness at these current levels. We stated this morning the NASDAQ had to hold 12,950. The NASDAQ futures only hit a low of 1,3060. We are not day traders so buying any 5% dip in the NASDAQ is not working getting out of bed for. I still am a seller of the NASDAQ names, but not at this level. As we have discussed many many many times, I want to be proactive not reactive. Proactive is selling at 14,000 on the index as we said. Reactive is selling into weakness and too late.
- Tomorrow at 8:30am we have CPI and its going to make or break the NASDAQ. A much hotter number will crush the index potentially to retest today lows. While a much less than expected number will potentially have the NASDAQ test 13,550 and potentially higher. Inflation and expectations is everything for the NASDAQ now. CPI is back award looking, so its possible a retest of 13,060 is bought if the number comes in a lot hotter than anticipated.
- Last month: The Consumer Price Index for All Urban Consumers (CPI-U) increased 0.6 percent in March on a seasonally adjusted basis after rising 0.4 percent in February, the U.S. Bureau of Labor Statistics reported today. The March 1-month increase was the largest rise since a 0.6-percent increase in August 2012. Over the last 12 months, the all items index increased 2.6 percent before seasonal adjustment.
- Below is the annualized forecast for CPI from the BLS. It will take a lot tomorrow to negatively shock the market, as I believe the markets are already pricing in a significant ramp in inflation for the next quarter or 2.
May 11th Premarket
Futures look ugly this morning, but I think anyone looking at yesterdays close could see there was no bid the last few minutes which was unusual. Just a quick note on the S&P 500.
- S&P 500 futures have a lot of support at 4,109, which needs to hold on a close or the index will test an important level which is the mean of this upward trend of 4,080, if you close below this you will get to 3,970. I think if you hit 4,080 today it will bounce off that. For longer term investors, wait to get long. The index is so massively overbought 3% is not enough of a pullback for the risk reward.
- NASDAQ need to hold 12,950, or 12,200 is in play, which might be a decent risk to reward long set up.
May 10th
Today the markets are now starting to worry about inflation. Which we have stated, we have no idea if this current jump in inflation will be transitory or not. However, it doesn’t matter because commodities are telling you all you need to know. Below is the S&P GSCI commodity index and while it broke out 2 months ago of its 10 year declining channel, now today markets are worried of the risk maybe its not transitory. No one knows if it will or will not be transitory.
However, what I will say are two things about the period of inflation.
- How often do you see inflation rises in food and homes to reverse quickly or decline at all? I do not recall a period unless you get a severe economic down turn, which I do not see.
- Commodities trend very well, especially because most of the investors within this asset class are trend followers and systematic global macro traders. After a 10 year decline, I just don’t see this trend ending so soon.
This is why we have said for over 6 months now we disliked Technology as this sector is most at risk of inflationary pressure that will contract multiples.
- The NASDAQ needs to hold 13,300 on the futures. A close below this level the index has little support until 12,900. Maybe we walk into tomorrow and we are up 300, However, I think at this juncture, we all realize high growth is currently not a safe place to be hiding out right now. I felt this way since October and I still feel that way.
- The Fed is not going to do anything about being less accommodating after Fridays jobs number, yet inflation is picking up. Furthermore, I believe the Fed is off based to tied all policy strictly to pre Covid job statistics. The weak jobs number this pass Friday in my opinion was a result of labor shortage and not economic weakness. The State and Federal unemployment benefits has created a situation where anyone making less than $32,000 a year does not want to return to work.
- Lastly, now we are seeing something new, “wage inflation” starting to creep into the markets. Today Chipotle said it is raising its minimum wage as they cannot find workers and McDonalds is in discussions as well to do the same.
May 7th
Mid morning
Just a remember the S&P 500 hit our 4,220 level were reducing more equity exposure is warranted. Let me stress, this is not an attempt to call market tops. As we said a week ago, it is possible we see a 1995 and 2018 melt up were the blended S&P 500 model reach 100. At which juncture we could see 4,300, I did say I didn’t think we would get to 4,300 without a pullback first. Unfortunately , I don’t call 2% a pullback to 4,120.
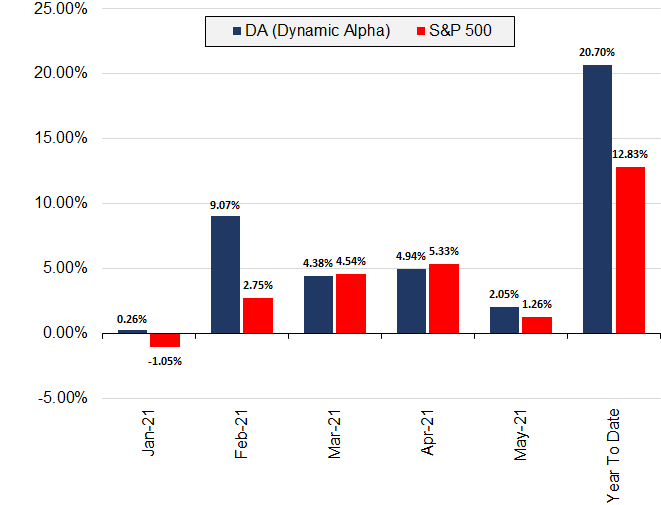
I have also respectively said everyone has a different objective and risk tolerance. The way our firm Trowbridge Capital Partners manages money is a risk first approach. We care first and foremost about migrating large draw downs not crushing the S&P 500 with excessive risk. As of May 7th our Dynamic Alpha portfolio is in 50% cash, but we are already up 20.70% for the year. This is the trade off for any investor. If the markets not make a parabolic move higher we will certainly miss out.
Remember, there is no way to neutralize risk perfectly without sacrificing some upside. We just want to be as systematic as possible and that is why I have been suggesting at large levels reducing some not all equity exposure.
 Disclaimer: Trowbridge Capital Partners is not an entity of ChartLabPro.com
Performance data quoted represents past performance. Past performance is not a guarantee of future results and current performance may be higher or lower than performance quoted. Investment returns, and principal value will fluctuate and shares when sold or redeemed, may be worth more or less than their original cost. PAST PERFORMANCE IS NOT INDICATIVE OF FUTURE RESULTS. The performance figures are net of fee performance. Actual investment advisory fees incurred by clients may vary. Performance does reflect dividends reinvested and commission generated from transactions. S&P 500 compounding return is calculated using daily data based on the closing price with dividends. Data provided by yahoo finance via Interactive Data.
NASDAQ
As for the NASDAQ I have been saying reduce technology exposure at 14,000 and still think the same. I would also as I have said many time now reduce technology if the 10-Year Yield reaches 1.40% to 1.45%. This is because their is big support at this level and will give the shorts a chance to reload for higher yields.
I won’t be writing the rest of the day as I am sure everyone is tired of my emails.
Premarket
Wow a very disappointing April payroll. Some whispers were for 2 million new jobs and the consensus was 1 million. The number came in a just 266k. My theory is lower wage job workers are making too much in unemployment benefits to go back to work. McDonalds is now pay some applicants in Florida $50 to interview. If that doesn’t tell you something about the current shortage of workers, I don’t know what will.
In reaction the 10-Year Yield took a nose dive down 5.10% based on Fed tapering expectations. In contrast, the NASDAQ jumped 200 points as rates were hammered to a 2 month low. I am uncertain the NASDAQ will hold these gains as the 10-Year Yield has rallied off the lows gaining 3.5% since writing this.
We will be back after the close of market today.
May 6th
Once again the market demonstrated unbelievable resilience almost ignoring all the negative news. Today’s close had all the makings of a short covering melt up into the close.
I say this for the following reasons:
- There was no positive catalyst’s for the S&P 500 to rally 34 points and the NASDAQ 110 respectively.
- We actually had negative Fed rate talk early morning as Dallas Fed President saying the Fed should start tapering sooner rather than later.
- Biden said he will keep Trump’s Investment Ban to keep pressure on China.
- Late day into the close the Federal Reverse released its semi-annual Financial Stability Report stating the following:
- “…should risk appetite decline from elevated levels, a broad range of asset prices could be vulnerable to large and sudden declines, which can lead to broader stress to the financial system.“
- “Elevated equity issuance through SPACs also suggests a higher-than-typical appetite for risk among equity investors.”
- Vulnerabilities associated with elevated risk appetite are rising. Valuations across a range of asset classes have continued to rise from levels that were already elevated late last year. Equity indices are setting new highs, equity prices relative to forecasts of earnings are near the top of their historical distribution, and the appetite for risk has increased broadly, as the “meme stock” episode demonstrated. Corporate bond markets are also seeing elevated risk appetite, and the spreads of lower quality speculative-grade bonds relative to Treasury yields are among the tightest we have seen historically. The combination of stretched valuations with very high levels of corporate indebtedness bear watching because of the potential to amplify the effects of a re-pricing event.
After reading a few excerpts from the Fed’s Financial Stability report they absolutely know they are inflating a bubble and realize that they need to keep the bubble going or else it will all collapse causing significant pain. At all costs Powell will keep the narrative no inflation long term and rates are going nowhere.
May 5th
Early Morning
- Markets early trading got a lift after Yellen walked back her comments about inflation and rates, especially the NASDAQ. At all costs the Fed and now the Treasury will do what is necessary to convince markets that there is no inflation. Yesterdays reaction is a warning to those investors who think valuations can be supported at these levels without the Fed easy monetary policy.
- The question is will historical multiples ever return to normal as it seems plausible that the Fed will never be able to remove their bond purchases or raise rates.
- While I am not bearish because of the technical set up, I am very concerned how dependent upon the market is on the Fed at these current valuations, especially as the economy does not need emergency liquidity programs. Granted this has always been the case since the Fed’s existence, but never more so than now.
Mid Day
- Mid Morning the markets did give up the early gains as yet another economic data point suggested the potential for growing concerns over stagflation. ISM Services disappointed with their April expectations as output declined, however, prices increased. Although, the bond market did not really reflect this.
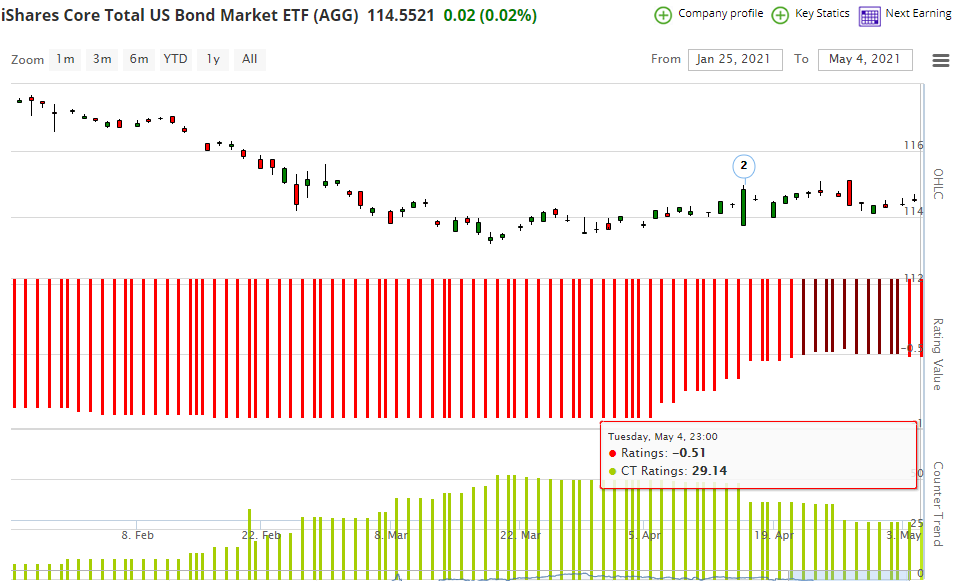
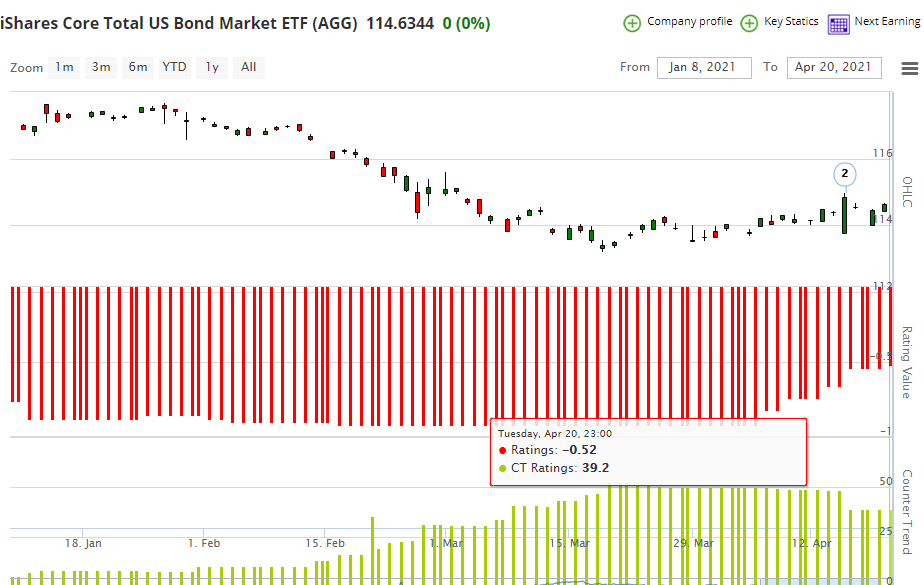
- The reinflation trade (financials, energy, materials) was bid for again for a second day, while large cap tech was weak. However, longer dated yields were negative. As we have said for weeks, until this oversold condition is worked off, in my opinion it will be hard for yields to move a lot higher or breakout. Our Counter Trend for AGG is still a +29.14, which is rather oversold. See chart Below.
Late Day
- Late day trading the NASDAQ reversed almost 160 points from it’s high on news the White House will back the WTO plan to Waive IP Protections for COVID Vaccines. While this is not a real catalyst in my opinion for a real sell off. It is another anti-probusiness move from the government, which was perceived negatively. The NASDAQ was hit the hardest on a relative basis as U.S. technology is especially sensitive to IP as the sector has been fighting to keep it’s IP protected from China. The bottom-line line is, it won’t take too many negative catalysts to start eroding the short term positive trend at this massively overbought condition.
IMPORTANT: Job number May 7th
Friday we get the jobs number and this is the most important data point right now as the Fed policy is strictly tied to the employment rate. The consensus just around 1 million jobs created. However, it is well publicized the market is looking at close to 1.5 million jobs created. I would fully expect anything greater than the whisper number of 1.5 million for the markets to spike significantly and sell off hard as rates will rise in fear of the Fed moving. However, the Fed is never going to taper and this will be an overreaction.
Job number May 7th
Friday we get the jobs number and this is the most important data point right now as the Fed policy is strictly tied to the employment rate. The consensus just around 1 million jobs created. However, it is well publicized the market is looking at close to 1.5 million jobs created. I would fully expect anything greater than the whisper number of 1.5 million for the markets to spike significantly and sell off hard as rates will rise in fear of the Fed moving. However, the Fed is never going to taper and this will be an overreaction.
May 4th
Markets also took an additional hit right after our morning email as Janet Yellen had a pre-record speech at The Atlantic Future Economy Summit. However, she has no control over monetary policy, so does it matter what she says anyway? No, and the weakness in Tech has been evident for several days prior. Here are the two statements from Yellen that hit the markets.
- “It may be that interest rates will have to rise a little bit to make sure our economy doesn’t overheat”
- “We’ve gone for way too long letting long-term problems fester in our economy”
The markets were mixed later in the afternoon as the reinflation trade was alive and well and bid, like Materials, Energy and Financials. I actually think the S&P 500 was very strong. The NASDAQ held its support level we discuss of 13,400 today. We will have to see what tomorrow brings for the index.
Oh but wait, before the ink could dry, Yellen walked back her comments on The Wall Street Journal’s CEO Council Summit
- “Let me be clear it’s not something I’m predicting or recommending”
- “transitory for the next six months or so”
- “if there is an inflation problem she is certain the Federal Reserve can be counted on to address it”
The word of the Day “Stagflation”
Now every Bank is worried about inflation! The consensus by most Wall Street strategist is that rates will continue to rise in Q3 and Q4 as there will be a temporary rise in inflation. However, the real outlier is once all the monetary and fascial emergency stimulus is exhausted, will inflation moderate significantly. This spike in inflation caused from all the excess stimulus, will presumably put a drag on the economy as prices of homes, autos, food and energy continue to rise. his could ultimately cause stagflation, as higher prices put a drag on the consumers purchasing power, thus hampering economic growth without additional stimulus or real wage growth.
We have been rather adamant about reducing technology once the NASDAQ hit 14,000. As you will recall, we believed this regime change from growth to value was not over and have been less bearish on the S&P 500 because of its diversification. Investors are now getting concerned and talking about stagflation. Yesterday we saw this with rising prices with weaker ISM than expected. Today we got a weaker US Factory orders but higher prices. The last thing we want is weaker economic data points with higher prices. As you know, I always say when you are this overbought in this case a 96.70 on the blended model, the market will just just create a new narrative to worry about to cause selling. At the end of the day, the pullback is strictly a result of mean reverting technically.
Market Levels
- NASDAQ (futures) has a large support level at 13,400.
- S&P 500 (futures) has a large support level at 4,080
May 3rd
The only real market catalyst in my opinion today was ISM Manufacturing and Markits Manufacturing PMI. The early reaction was deflationary as the 10-Year Yield reverted 3.25% causing the NASDAQ to rally 90 points and the RUSSELL to revert lower off the initial headline numbers. While the numbers came in exceptionally strong on a historical basis, the market was disappointed. There is a lot going on within these numbers as the readings were pushed higher from delays and prices paid increased. But the initially take away was the market (NASDAQ) seemed almost relieved the numbers didn’t come in as hot, almost alleviating some inflation fears, even though prices paid did increase.
However, by mid morning the NASDAQ reverse 170 points off the highs and the 10-Year Yield recovered 2.25%.
April 30th
Month end and some rebalancing for May.
- Rates once again declined on 2 strong economic data points today, which can only be a result of bonds still being in an oversold condition.
- Strong economic data today, yet the inflation trade moved lower? The market had an inverse reaction today as University of Michigan Sentiment & Chicago PMI came in exceptionally strong. Yet, yields reversed lower, Small caps were slammed and reinflation sectors like Financials, materials and energy were hit the hardest.
- University of Michigan Sentiment hit a new pandemic high in April from 86.5 to 88.3. Oddly, you would assume an increase in consumer confidence would lead to a rise in yields and not a decline of 1.40% on the 10-Year.
- Furthermore, Chicago PMI ripped higher from 66.3 to 72.1 in April. PMI has not had a reading this high since February 1980. Again, why are rates not moving higher off this expansionary economic data?
- S&P 500: The blended S&P 500 model is now at a 96.70 the third most overbought level since 1992. This is why we sell or reduce equity exposure in tranches and not all at once. Know one can time the market, we are simply reducing risk at frothy levels. We have stated, reduce equity exposure at 4,130, 4,180 and waiting for 4,220 to reduce more. Can the model reach 100 obsoletely, there is roughly a 12% probability if we use historically calculations. 100 would take the index to roughly 4,300 on the index. However, I think we are closer to seeing a pullback than advancing to 4,300. I would like to see a nice healthy pullback to 4,036. If 4,036 does not hold the bigger level to get more aggressive would be 3,950.
- NASDAQ: Nothing has change in our opinion here and still do not like higher multiple technology for the basic fact once the oversold level on bonds is worked off, the 10-Year Yield will at least retest 1.77% if not break above this level. A break above 1.77% will cause another reset in pricing.
April 29th
- April 29thA lot of things happening today in the markets. As yields go so does the market.
- Growth at a reasonable price: Today was a good example of what we talked about a few weeks ago about understanding buying growth stocks at a reasonable price. It is my opinion as rates rise higher multiple growth stocks will be most effected. As we stated, Facebook was fundamentally cheaper than an Apple based on its growth rate and forward multiple. Thus Facebook would hold up better if rates rose. This morning both reported earnings and saw their prices significantly rise initially. However, Facebook held onto its gains, while Apple faded 4% into the red. This in my belief is because FB was relatively much cheaper vs. AAPL. Again, I am not a fundamental analyst and a quantitative trend follower, so take my point of view with a grain of salt.
- Yields: Today the economy saw positive jobless claim numbers, although this was expected. Job numbers is the Key to everything in the market right now as it will dictate the path of the Fed’s tapering. Shorting after the job number release, the 10- Year Yield jumped 4.00% to a meaningful resistance level of 1.677% before reversing. This was one of 2 main catalysts why the NASDAQ peak to trough reversed almost 260 points. (see chart below)
- The Administration: Another factor for the reversal in the market today was news that the administration would start to view gig employees as apart of employment numbers. These would be Uber type of jobs. This is perceived to be important because it would positively skew the job numbers, ultimately that could impact the Feds tapering decisions. I personally think, its a big nothing to worry about.
- S&P 500: The S&P 500 futures hit an all time high of 4,210, almost hitting our target of 4,220. The S&P 500 had every opportunity to make a key reversal of a significant gap up opening to close red. However, rallied back significantly to close at 4,195.
- NASDAQ: The NASDAQ Futures as well hit an all time high today at 14,064. I have been very cautious on tech and still remain so as I do think rates are going higher. However, the index was saved today from a key reversal. The index had every opportunity to fail today and could not.
April 28th
Today was Fed day. The market is beyond resilient and the price action is exceptionally strong. The S&P 500 once again made an all time high intra day before reversing. The S&P 500 futures hit 4,193.75. As we mentioned, we are looking for 4,220 to reduce more exposure.
Today was Fed day. The market is beyond resilient and the price action is exceptionally strong. The S&P 500 once again made an all time high intra day before reversing. The S&P 500 futures hit 4,193.75. As we mentioned, we are looking for 4,220 to reduce more exposure.
The story with the Fed remains the same, why should this day be any different:
1. At all costs control the narrative of inflation being transitory.
2. Committed to not removing any liquidity programs or rates for the foreseeable future.
3. The economy is growing and improving
Its really astonishing the Fed is still in the market purchasing $120 billion a month at this part of the cycle. As we mentioned several weeks ago, how can the Fed know if the rate of change of inflation will be transitory. We said its impossible for them or anyone else to truly know this. Just yesterday Jeffrey Gunlock told Bloomberg, the Fed is essentially guessing and hasn’t a clue if inflation will be transitory. Hopefully they are right and there will be a smooth transition. The Fed is so backed into this corner now, the slightly move off zero rates will trigger significant market disruption.
As we mentioned several weeks ago, how can the Fed know if the rate of change of inflation will be transitory. We said its impossible for them or anyone else to truly know this. Just yesterday Jeffrey Gundlock told Bloomberg, the Fed is essentially guessing and hasn’t a clue if inflation will be transitory. Hopefully they are right and there will be a smooth transition. The Fed is so backed into this corner now, the slightly move off zero rates will trigger significant market disruption.
I firmly believe nothing matters now except the Feds narrative. Today, they were able to talk down the middle to the long end of the curve in Treasuries. If they can keep this magic act up equities will keep moving higher. Multiple’s will just keep expanding as long as revenue comes in slightly better than expectations on earnings. Tonight you had just that with FB – Facebook and APPL.
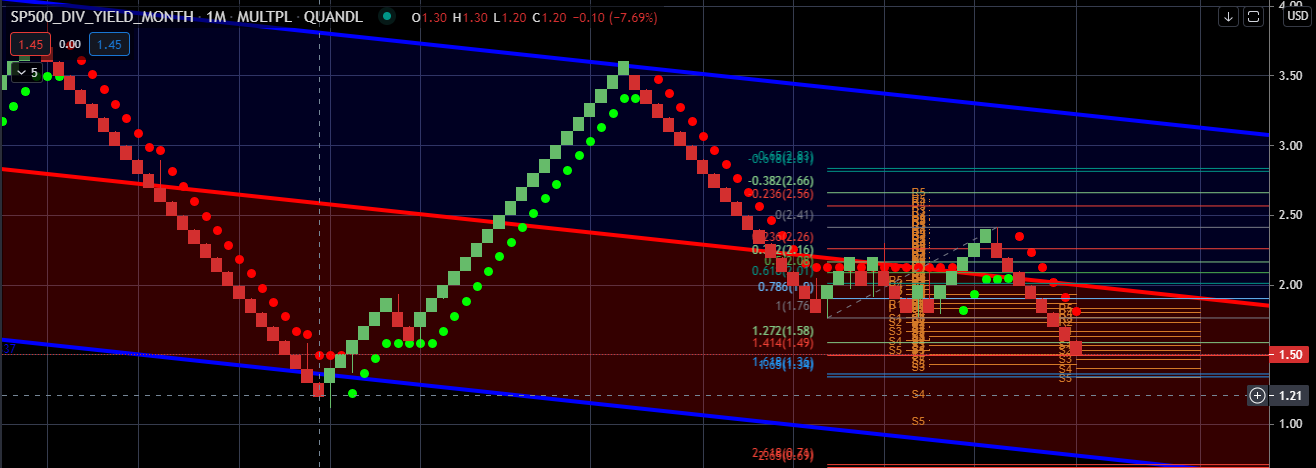
S&P 500 Multiple Yield
Below is an interesting & fun looking chart. The S&P 500 is now yielding 1.45%, the lowest yield since 1.20% in 1999/2,000 which was the lowest yield ever for the index. Has the market structurally changed forever because of Central Banks intervention and will we see 1.20 in this cycle?
Friday 23rd
Another Day another S&P 500 record high. However, the market has been seeing some selling pressure the last 20 minutes in the last 2 days. You have AAPL, MSFT GOOGL and AMZN reporting this week. They make up over 20% of the S&P 500 market capitalization, however, I don’t think in-line earnings or even a miss in earnings will derail the market. This is because true fundamentals don’t matter. Until, the Fed or the market starts to hint at reducing the emerging $120 billion monthly liquidity purchases the market has a back stop.
TSLA reported earnings and while I will not go into the valuation. Here is a interesting note from Zerohedge I could resist highlighting.
- TSLA reported $594MM in income from operations, but regulatory credits accounted for a whopping $518MM of it, the highest on record and up from $401MM in Q4 2020.

- So while GAAP net income was just $438MM, this means that for yet another quarter the company did not generate actual net income without regulatory credits. Add that another $101MM in profits came from “sale of bitcoin”..
- TSLA owning $1.3BN in digital assets at the end of the quarter, which means it sold around $272MM of the bitcoin it previously owned.
- So in addition to over half a billion in reg credit sales, made $101MM in profits from sale of $272MM in bitcoin (reducing its total from $1.5BN to $1.331BN at the end of the quarter).
Enough with TSLA. We have CPI on deck and that will trigger the markets. However, I still think Yields on longer dated bonds are going to trade in a tight range until bond are bought and the shorts get a chance to reload. I think investors need to reposition their positioning IF and when the 10 year does retest 1.40 to reduce technology and get long financials.
Sunday, April 25th
Food for thought
I thought I would provide some simple insight not with the markets but more on process. Investment process is one of the most important aspects of investing. While this lesson may seem logical and for beginners, it might help you generate more alpha and become a better investor.
Diversification
Diversification is vital for both performance and risk management. Diversification often is thought of correlation or “correlation coefficient”, how two assets move together in relation to each other. For a well diversified portfolio we want assets that have low correlations with each other. Think in terms of equities vs. bonds, historically equities fall, bonds rise and protect a portfolio to a certain degree because of the inverse relationship. I realize this is investing 101 and you get this concept already. I am not going into the benefits of the correlation matrix of assets and sectors. But if you are a long term investor and don’t have an understand of your diversification within your portfolio, you certainly should.
Today we want to talk about another type of diversification besides correlation, “time”. Yes, time can help you generate alpha and mitigate risk, especially when markets are oversold and overbought.
Lets take this hypothetical example of Investor A.
Investors A. allocates his/her portfolio based on several trade and investing strategies and time periods. As a systems trader/investor, I like to have a process that is mapped out and will work for most investing periods. Each time frame should have different sell rules, which we will not discuss today.
What I want to discuss is the shorter term swing trading as the S&P 500 is very overbought. As we raise cash in stocks that have massive gains, we can still take advantage of potential new opportunities that are just starting to breakout. Selling stocks in our portfolio that have had massive gains over the last 4 to 6 months and overbought is prudent as they will sell off the hardest in a correction. However, stocks that have not participated and just starting to break out or just moved to a 5 or strong buy could have some potential to outperform the index.
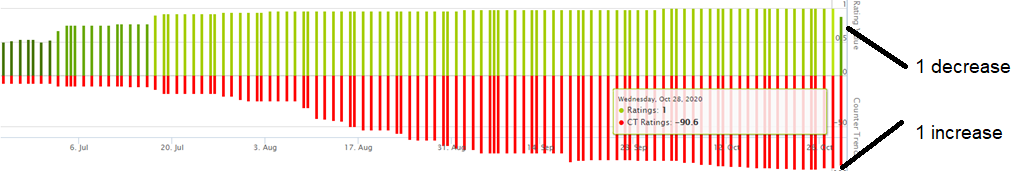
The second graph is how I visualize how to both proceed with caution and yet try to take advantage of short term trading in massively overbought markets.
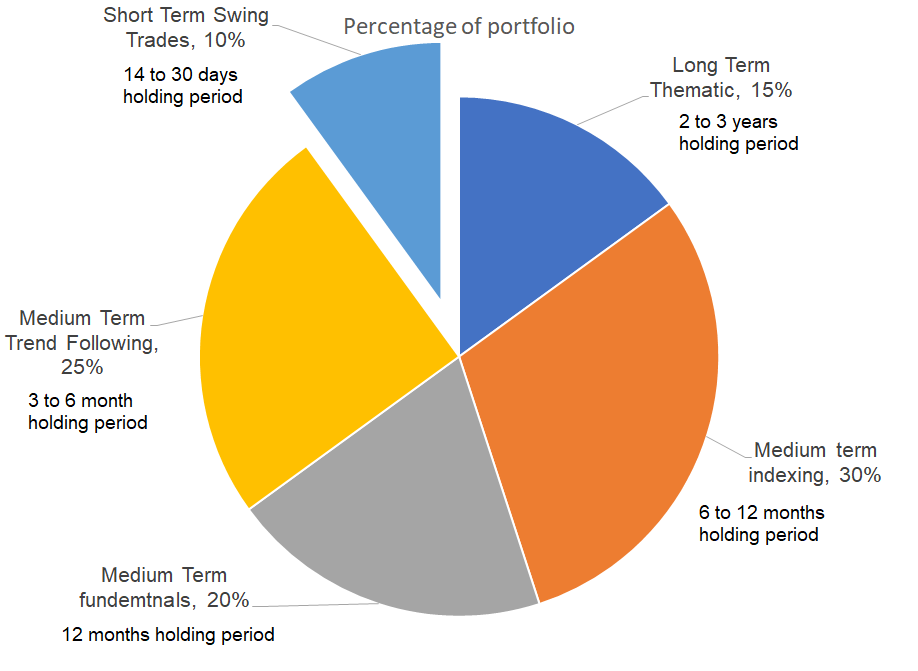
Since these swing trades are meant to be lower risk and shorter term. I will typically look to exit the position with either 1 rating value decrease or 1 CT increase.

Well today was interesting to say the least. New all time high on the S&P 500 at 4,186.75. Yesterday was rather telling, as we mentioned the price action wasn’t that bad based on the news in my opinion. I think today was nothing more than large funds positioned for a sell off. Once the indices couldn’t break lower at the open, coupled with better economic data, the short covering began to cover. Once covering started, the intra data day system traders bought to take out every support level. The move was completely mechanical.
New home sales came in the highest in 15 years and U.S. Manufacturing and Service PMI rocketed to record highs. However, yields did basically nothing with the 10-Year Yield up .90bps. Both economic data points clearly suggesting more inflation. However, as we know bonds are still oversold and need to work this off before yields can take out the 1.77% level.
For those investors who reduced exposure at 4,180, there is nothing to do. As previously discussed 4,220 is the next level to sell into. The question we get a lot is how much cash should investors raise. Unfortunately, that is not something we can answer for you. It comes down to your preference and risk tolerance and time frame. The your higher risk tolerance and longer the time frame, the less you will want sell is a general rule of thumb.
This process has worked well for me over the last 2 decades. For those oh you who invested in 1999, will realize you can’t have your cake and eat it too. We want to be proactive and not reactive, not to sell after the selling has taken place.
I did not think today’s sell off was that bad. We held the lows from Monday on all the indices. I question, who didn’t see Biden’s aggressive tax plans coming? For weeks he said infrastructure spending was going to be supported from higher taxes. Granted, the Capital Gains tax increase was maybe more aggressive than many were expecting, almost a double! From my understanding, its almost double the current rate of 20% on Capital Gains rate for those who earn more than $1 million in ordinary income. This is very different, but equally as negative as higher corporate taxes for the markets. Why is this so relevant to the market?
- More Selling: You will get a large amount of investors who will front run the higher rates by selling now at 20% Cap gains rate. This will put a ceiling on the rally in theory. However, maybe the liquidity in the system will soak it up. We can’t quantify how this plays out.
- Less long term support: You will also get less long term capital coming into the markets that will bid up the market creating less demand.
- Not Pro Business: Lastly, the other reason, this will be perceived as unfriendly economic not pro-growth policies from the administration.
- Overall the price action in my opinion wasn’t as bad as it should or could have been. Well off Mondays lows, however, that doesn’t mean we wont see follow through tomorrow.
- We have said many times rates would be an issue only until it smacks investors in the face.
- Now many bulls will suggest this will never get passed, but they are missing the bigger picture. Biden is not about Wall Street friendly policies and this just should everyone how serious he is.
Conclusion:
Don’t buy into the first 1% pullback when the S&P 500 model is still at a massive 95 overbought reading. You will get a much better chance as the odds of a further decline is growing. Massively overbought markets as we have said repeatedly take weeks to correct, as dip buyers keep buying strength. This is the biggest mistake cause by behavior bias of past trends.
However, there has been not technical damage.
- S&P 500: Until the S&P 500 closes below 4,100, nothing really has changed. A close below 4,100 will test at least 4,040
- NASDAQ: Until the NASDAQ closes below 13,670, nothing really has changed. A close below 13,670 will test at least 13,402

- Yields drifted lower and the NASDAQ caught a bid. The fact the NASDAQ recovered from the lows around 10am and the quants kept bidding up any pullback throughout the day as shorts got squeezed. We keep seeing this over and over throughout the last 18 months. As we have said, 90% of the intraday volume is derived from Quants, this is not fundamental investors driving the market anymore.
- Investors over the last few weeks have been de-risking, according to Goldman Sachs fund out flows saw their highest levels in several quarters. Sell side strategist including (Goldman, Morgan & BofA) and including ourselves all have said in the past few weeks the markets were becoming overbought.
- So was that it, a 2% pullback and now we take out the highs? I am not sure, but if we were going to correct, today was the chance to close lower and we couldn’t fail. This was massively bullish.
The S&P 500, NASDAQ and RUSSELL
- A complete reverse of yesterdays small cap and financial weakness as the Russell lead the indices higher up 2.07% at its high. The NASDAQ was most impressive as the index rallied over 160 points from its low to high today. However, the NASDAQ was the weakest performer today of the three indexes.
- Today had not impact on our view.
- We are in the camp of scaling out as we go higher period:
- S&P 500: If you already reduced exposure at 4,1800 (futures), do nothing until IF & when the index reaches 4,220.
- NASDAQ: If you already reduced exposure at 14,000 (futures), do nothing until IF & when the index reaches 14,450.
The one thing I am watching closely are Treasuries. Bonds still have not rallied enough to have worked off the massively oversold level. The counter trend (CT) which is our proprietary way of measuring overbought and oversold conditions is fair superior than how traditional technicians use RSI. The CT is still reading a 39, which is still oversold and I would expect before Treasury yields resume higher, the CT rating could get close to 0. This is exceptionally important and it will dictate the rotation of the next move into the NASDAQ or Small Caps and the early cyclical trade. I have no conviction at this current level, I just want everyone to understand this is what I am watching closely.
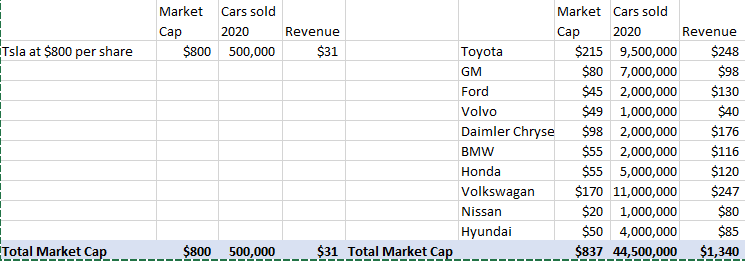
In the last two weeks I had a few people mention TSLA to me and while I don’t recommend stocks, I did want to point out a few things fundamentally. As we all know, ChartLab is a trend following system, so we don’t care about fundamentals with our signals. TSLA is a great trend following stock to trade, however, fundamentally, I personally think the valuation is not rationally priced. While I am a believer that the EV market will dominate the future of car sales, that doesn’t mean TSLA at the current valuation is logical.
As we see below, TSLA at $800 a share had a market cap of $800 billion, $37 billion less than the largest 10 car companies in the world combined $837 billion market cap. TSLA sold 500,000 cars vs. 44,500,000 million collectively for the top 10 care companies. Understandably, TSLA growth of units sold and revenue is significantly higher than these other companies. However, my question is not so much on the current valuation, but the future of these other 10 companies. Is it to be believed that these other companies will have little participation in the EV market in the future? I highly doubt it, so one side of this equation is missed priced on expectations of the future.
Volvo is on record stating, Volvo Cars is committed to becoming a leader in the fast-growing premium electric car market and plans to become a fully electric car company by 2030. By then, the company intends to only sell fully electric cars and phase out any car in its global portfolio with an internal combustion engine, including hybrids.
This is not a recommendation either way to buy or sell TSLA, just a high level observation.
No catalyst for today’s weakness, this is purely technical. Stocks with the great 6 month returns like the massively overbought financials and small caps were pounded today. Overall the NASDAQ and S&P 500 had no real damage. For almost 6 months the reinflation, early cycle trade has outperformed and this is purely some reversion. The question is how do we make money going forward. There will be a great opportunity to get long, however, we first need more downside for a better risk to return set up. There is no certainty this will occur, however, this is what we hope for.
No change in our view. We have expressed our view to reduce risk in equities for several weeks once the blended model reached 95 and 95.90 respectively.
Levels we have discussed
- We said reduce equity exposure at 4,130 and 4,180 respectively on the S&P 500
- We said reduce tech exposure at 14,000 on the NASDAQ
- For several weeks we have said reduce exposure to financials and small caps via the Russell
The levels to watch are the following on the indices.
- S&P 500 (futures) has a lot of support at 4.060 and if that can not hold you can see 3,964 then 3,823.
- 3,964 is a massive level
- NASDAQ (futures) has a little support at 13,699 then 13,402.
- RUSSELL (futures) has big support at 2,090.
- Massive level 2,070
Monday, April 19th The Close
Many of you expressed that you would like to keep receiving emails, so we will try doing both emails and the commentary on the site. Friday the S&P 500 blended model hit 95.90 the same reading as August before the S&P 500 corrected almost 10%. This is the third most overbought reading since 1992. Today we had no visible catalyst for the weakness in the indices and we will not attempt to forecast if todays move will lead to a correction. However, as we have pointed out, the model does suggest this seems probable. The only constructive part of today’s price action was the fact that the S&P 500 closed relatively strong. Again to reiterate, I do not believe investors should ever try to time the market by being 100% in cash, unless its a complete outlier event.
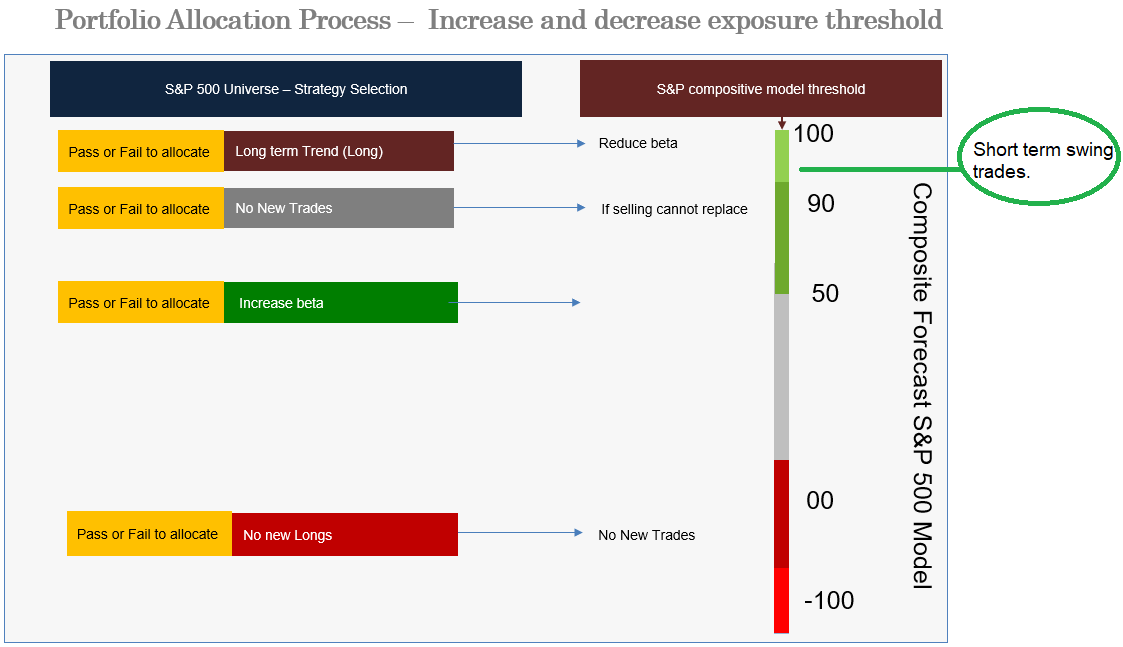
- We want to increase and decrease the risk to equity exposure based on the S&P 500 blended model to manage risk. We do not want to make it a binary event (all or nothing).
- Many of you should have been scaling out at 4,130 and 4,180 respectively.
- S&P 500 (futures) has a lot of support at 4.060 and if that can not hold you can see 3,964 then 3,823.
- NASDAQ (futures) has a little support at 13,699 then 13,402.
Bonds
The only Head Equity Strategist I ever pay attention to is Mike Wilson at Morgan Stanley, the rest rarely put their necks on the line or get it right. Mike recently said, “if rates didn’t move up on the back of record economic data surprises last year, it’s not hard to see why they didn’t react more to the strong data of the past few weeks when it wasn’t such a surprise.”
While his thesis seems logical, I still think the recent weakness in yields was technical as we referenced AGG last Friday being massively oversold. Why is this so important? If rates truly reverted only because of technical mean reversion and not because the market anticipates this economic rebound is as good as it gets, rates are going higher. Thus, the next big trade theme will be predicated upon higher yields. Which will have a major impact on technology, speculative parts of the market and what will work best early or mid cycle growth trades.
Right now yields are in a holding pattern, so the answer is not clear yet.
Friday, April 16th The Close
- No change in our view from this morning regarding the indices levels.
- S&P 500 hit our 4,130 and 4,180 targets to reduce equity exposure. Next Level 2,220.
- NASDAQ hit our 14,000 level to reduce some tech exposure and next level is 14,430.
Bonds
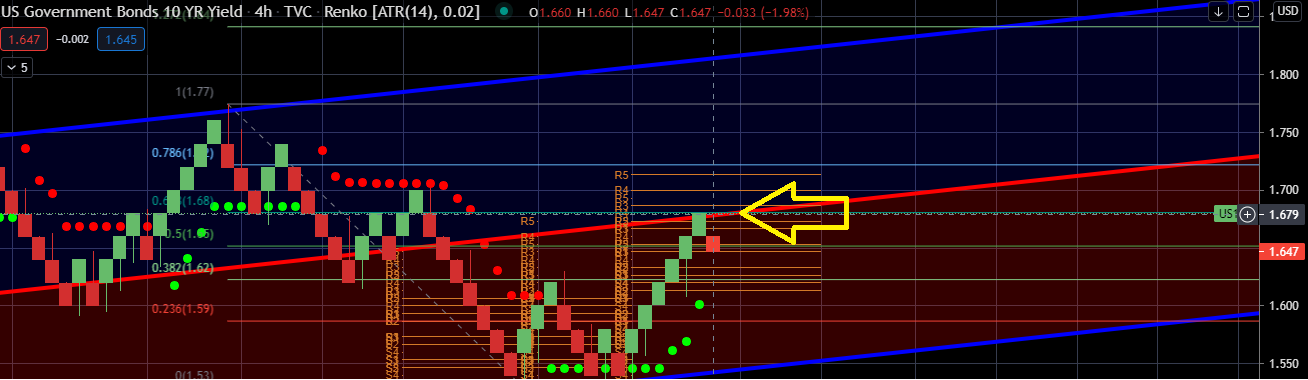
A lot of talk yesterday about the bond rally and why. As we have been saying for 2 weeks, AGG the Aggregate Bond ETF was massively oversold and a reversal in this condition could propel the NASDAQ higher. I don’t care about the reason, that is almost irrelevant, the bottom-line is AGG was the 3rd most oversold since the ETF’s inception since 2013. Bonds were destined to see reverse to the mean. Both cases previously where our counter trend model was above 50, it reverted to below zero. The model is now a 39, so yields could slide a little more if the model does revert to 0.

We wanted to point out for newer members, remember a 3 to 5 rating jump is ideal. Especially when the counter trend is green (oversold) and move then to a 5. Let me reiterate, our process is not to buy new positions once the S&P 500 blended model reaches a 90 reading. We are just pointing out good set ups, this is not a recommendation. Now if you are strictly trading and in 100% cash when the S&P 500 model reaches a 90, buying this type of position might be warranted.
Remember, half the battle in investing is your process for portfolio construction, risk management not just investment selection.

Past performance is not indicative of future returns.
Friday, April 16th Premarket
Today the blended model reading reached 95.62, which hasn’t really moved that much in the last week or so. However, we are now the 4th most overbought on the S&P 500 since 1992. The model is just approaching 1.20.2020 high of 95.90, which would take the index to 2,200.
To reiterate, we like using a scaling approach to reduce risk, never binary (all or nothing) as the model reaches 95.
Levels where we reduce risk.
- 4,130
- 4,180
- 4,220
Click to enlarge

Thursday, April 15th The Close
- No change in our previous view. To reiterate:
- Reduce exposure in equities at S&P 500 4,130 and 4,180 respectively.
- The S&P 500 (CASH) hit a high of 4,173.
- Amazingly, a close above 4,180 could take the index to 4,220. At which point, I would be aggressively selling long exposure. 4,220 would seem insanely euphoric on all metrics and a typical 7% correction would be larger at that level.
- Reduce exposure in technology at NASDAQ 14,000, 14,430 and 14,830 respectively. The NASDAQ (CASH) hit a high of 14,175.
Amazing to watch how the markets are completely driven by the quants. As JPMorgan published in 2017 90% of the intra day trading volume was from quantitative investors. Today’s move in my opinion looked and felt like trend followers (CTAs) and factor based funds moving the market all predicated on bond yields.
- Trend followers covered their profitable shorts in Treasuries as the 10-Year-Yield broke support at 1.61%.
- This unwind can move more as the oversold condition in treasuries seem to be on a path to normalized to at least its mean.
- As CTA’s / trend followers covered their shorts sending the 10-Year Yield down 6.63% today, factor based quants sold their reinflation trades, like financials, energy and small caps. None of these moves are really being caused by discretionary traders. As we have stated for over two weeks financials were massively overbought and overvalued and exposure to the sector should have been reduced.
- I would not be surprise if yields tried to rally tomorrow as at their low the 10-Year Yield declined 6.63%, closing down 5.48%. Any rally in yields will send the NASDAQ and S&P 500 lower. Inversely, the Russell should rally relatively.

Longer Term View On Yields
- My longer term thesis has not changed because of a shorter term technical reversion move caused by CTA’s in the bond market.
- As we stated previously, yes a reversion to 1.45% in the 10-Year Yield will cause a bid for the NASDAQ, potentially taking the index to 14,430.
- However, I don’t think inflation will be transitory and rates will bounce off support 1.40/1.45%, causing a sell off in the NASDAQ.
- IF the 10-Year Year does test 1.40/1.45 I do believe shorts will reengage sending the 10-Year back to 1.77%, if not breaking out to 2%. Which will cause significant selling across the index, with the NASDAQ getting the most selling pressure.
- You cant have your cake and eat it too! You can’t have all this liquidity and not have repercussions. Rates on the 10 year are not justified to trade at near the S&P 500 yield of 1.45% when the market is running at an annualized GDP around 2%.

Thursday, April 15th Morning
Today is very interesting to me. We had very strong retail sales, which was expected, but the headline number crushed expectations. Jobless claims came in the lightest in several quarters. Earnings rather solid. All slightly inflationary and negative for bonds. However, bonds are rallying exceptionally hard without a significant economic catalyst. The 10-Year Yield is down 5.16%, which could be technical. We stated last week bonds are massively oversold and a little reverse back to 1.45% on the 10-Year Yield is 1.45% would be possible and would propel the NASDAQ with fuel to move higher.
My theory and its only a theory is large institutional investors are hedging for a correction and getting long bonds. Many institutional investors cant buy options or short the market and will use Treasuries instead. There is always a reason for why the market moves. This could be the start of a topping phase until we correct and then once again move higher once again to new highs.
I am growing more cautious especially if larger institutional are now hedging equity risk by going long bonds.

Wednesday, April 14th Post Market
- No change in our previous view. To reiterate:
- Reduce exposure in equities at S&P 500 4,130 and 4,180 respectively
- Reduce exposure in technology at NASDAQ 14,000, 14,430 and 14,830 respectively
Extremely difficult market as Technology was weak at the opening bell as rates reversed yesterday’s declines and moved higher. Conversely, the Russell at one point was up 2%, with the inflationary trade back on.

Today we had the much anticipated IPO of COINBASE. The stock opened up at $381 and hit a high of $430 before actually trading below its opening price to $375. This caused some additional pressure on the NASDAQ sending the index down roughly 70 points. First let me state, I am no expert in blockchain which in theory make s a tremendous amount of sense for financial applications. However, crypto currencies is a different story, which I will not go into my opinion here.
While, I have not studied COINBASE well enough, I will say it seems like this a little aggressive with the valuation. Coinbase in my opinion is nothing more than a transitional broker and in some cases a bank, without a charter. However, unlike other recent IPO’s Coinbase is profitable.
“Coinbase announced its 2021 first quarter earnings on Tuesday, revealing that the crypto giant made a profit of between $730 million and $800 million on revenue of approximately $1.8 billion. The results amounted to a blockbuster quarter for Coinbase, eclipsing its performance for the entire previous year”
Basic Comp:
- COINBASE: Q1 Revenue $1.8 billion, Profit $800 million, Market Cap $90 billion at $344 price
- Goldman Sachs: Q421 Revenue $14.5 billion, Profit $4.3 billion, Market Cap $115 billion at $337 price
In summary, Goldman does roughly 7 times the amount of revenue and earns 6 times more than COINBASE. However, the two companies market caps were equal in value when COINBASE was trading at todays high of $430. Do not get me wrong COINBASE’s fundamental achievement has been nothing short of fantastic and the growth is extremely impressive. However, I question the following. Does a commoditized business, even if it is first to market in transacting the buying, selling, and storage of BITCOIN deserve the same market cap as Goldman Sachs???
Tuesday, April 13th Post Market
If nothing else, this market has become an entertaining spectacle. Don’t worry, the Fed will never remove the emergency liquidly programs because they have backed themselves into a corner they wont be able to get out of now. Therefore, to the moon with asset prices. Markets are so heavily reliant upon the smallest moves in bond yields, what can possibly go wrong.

- A spectacularly strong 30 year Treasury auction late in the day sent yields down across the curve, thus causing the NASDAQ to rally back to new all time highs touching 13,994.
- At this juncture if the 10-Year Yield does revert back to it’s the major support level of 1.45% as we discussed last week, that could be enough amination to propel the NASDAQ to 14,440 and possibly14,830.
- The big variable is can yields decline to 1.45%? It is certainly possible as we have discussed AGG (Aggregate bond index ETF) is massively overbought.
- Regardless of the where the NASDAQ trades if and when the 10-Year Yield tests 1.45%, I am a seller of all tech regardless if it is high multiple or growth at a reasonable price.
- The highest multiple tech stocks out-performed lower multiple names. Reinflation trades such as materials, financials, and the Russell came under pressure.
10-Year Yields

Monday, April 13th Pre Market
As we mentioned yesterday CPI would be a big market mover today as it would impact technology and the reinflation trade. CPI jumped 0.6% MoM (+0.5% exp) and 2.6% YoY (+2.5% exp). CPI was not as feared according to the tech sector, although it did increase at the fastest pace since 2009.
- This helped the NASDAQ find a hard bid to hit an all-time intraday high. As we stated, on April 2nd, “there is a little resistance at 13,450, but after that you could easily retest the old highs of 14,000″.
- I still want to de-risk too high multi tech names and stay at home stocks at 14,000. A close above 14,000 however, could get the index to the following resistance levels, 14,350 and then 14,888. However, I remain cautious and non-constructive on technology as I do believe we will see higher rates as the economy reopens this summer. The Fed may be right that the coming inflation will be transitory with only a brief and sudden increase. However, this will be a shock to technology regardless.
- Conversely the reopen – reinflation trade was pressured today like financials and cyclicals as CPI was tamer than expected. Personally, I am skeptical of real rate of inflation and I believe it is higher and the Fed has not a clue if it will be transitory or not. Although the market or in this case the headline drive quants controlled the price action of the day.
- Yield on the long end of the curve and relatively subdued today as the short end is down. Even though the long end is relatively unchanged, the NASDAQ is bid hard. This should be noted as a possible head fake for today’s rally in the NASDAQ.
Either way, we are just getting some mean reversion from the most overbought sectors to the most oversold as there is so much liquidity that keeps this market in a rolling rotation bull market.
S&P 500
The blended S&P 500 model is now at a 95 and sitting around our target of 4,130, reducing some risk is warranted. The next major level to reduce risk will be a 96 reading which would get the index to about 4,180. I am remaining cautious at these levels and would not be buying longer term positions at these levels.
Monday, April 12th
No Change in our opinion in the indexes from our Friday commentary. The indexes do look to be getting a little tired, however, that does not mean we cant rally slightly higher. Tomorrow we have CPI which will be a big market mover, more than earnings. The tell will be the reaction in Treasuries.
- Today, we had a mediocre at best 10-Year auction that helped yields stabilize and not rally to hard to close up .22% at 1.669%.
- Today we had the Fed’s Bullard say once the U.S. is at a 75% vaccination rate, it will be time to have the discussion of tapering the easy liquidly policies. We have seen this before with the good cop bad cop game within the Fed to try and control the euphoric prices.
- NVDA preannounced and jumped well above $600. We bring this up as not a recommendation, but as another example of a under-owned stock and slightly shorted as seen with our rating value and counter trend. Similar to Facebook, NVDA was slightly oversold with a strong sell -80 reading and increased consecutively to a buy. As trend followers we will never catch the low bid, but rather buy into better confirmation of strength.
- We hope tomorrow to have the commentary back online on the site and no more emails.
We do not own this or is it a recommendation, past performance is not indicative of future results. 
Friday, April 9th
More chatter among Fed members Thursday after the bell on potentially creating a new bond purchase program for 20 Year Treasuries helped equities catch a strong bid Friday.
We are almost at a 95 reading on the S&P 500 blended model. Remember, as we discussed, a 95 reading does not cause an imminent selloff, it typically takes weeks for the S&P 500 to correction if it does.
The last phase the S&P 500 blended model achieving a 95 reading is always the same. A panic bid from both short sellers covering and short term long only system traders ramping up into every close. There is always a possibility that this move turns out to be similar to the extremely overbought conditions as 1995 or 2018 when Trump cut corporate taxes from 28% to 21%. However, the model has only reached a 100 reading 12% of the time.
S&P 500: Today the S&P 500 closed at 4,128, close to the 4,130 level we discussed to take off some risk. The next major level on the S&P 500 to reduce risk is 4,180, which would get our model to about 95.50. The last time the model hit a peak of 95.91 back on 9.4.2020 the S&P 500 peak to trough fell 10% as seen below. The prior 95 reading was in February 2020, which was an outlier as the market fell 30% plus peak to trough.
Again we are not trying to call tops, that is not the objective, the objective is prudent portfolio management and creating a process for risk management. As I have said for a long time, we have not seen anything remotely resembling a blow off top that ends this bull market.

NASDAQ: Today the index closed at 13,900. 14,000 is a level we mentioned to reduce some names that are correlated to the index or the stay at home stocks that have massively extended multiples.
For those who are new to our process, it is never a good idea for long term investors to go to 100% cash in overbought markets. As we mentioned, corrections off these overbought 95 readings are often shallow and quickly firm up. All we are attempting to do is capture profits and redeploy those profits after a 6% to 8% pullback on the index.
Thursday, April 8th
Almost like clock work!
Yields down
Dollar down
NASDAQ up
As we stated last Friday “The index closed at 13,334 and our rating value had a nice move from a .14 to .50. What was bullish was the rating value was consolidating at .14 for 3 weeks. There is a little resistance at 13,450, but after that you could easy retest the old highs of 14,000. The only thing I will say as a contrarian point of view are bonds are very oversold. As we pointed out last week, the AGG ETF has a counter trend of +50. So if the 10 year can’t break out above 1.75, the NASDAQ could find some legs to its all time highs”.
NASDAQ update:
While close above the 14,000 NASDAQ level will most likely be constructive, I am a seller of tech, especially the higher multiple names or the stay at home tech names. I do not believe the 10-Year Yield will close below 1.45%, and this current retracement in yields will be short lived. Thus, continuing the longer term trend of higher rates causing pressure on technology.
S&P 500 Update:
As we stated for the last week, we are look at the S&P 500 to test the 4,100 to 4,130 level. Currently after hours the S&P 500 futures are trading at 4,095. To reiterate, I want to take down my risk in this range. As the blended model keeps increasing above 95, slowly keep reducing risk. Remember, when the S&P 500 becomes this extended, corrections don’t immediately happen. It takes a while for sellers to overwhelm buyers.
- Momentum will sell off hardest that will the following:
- Stocks in your portfolio that have the greatest 6 and 12 month returns
- Have the highest Counter Trend on ChartLabPro
- Stocks that have the highest beta
- The NASDAQ should perform better as it already had a correction and not overbought
- Financials, Materials and Industrials will reverse hardest
Wed, April 7th
Slow day, very little to report.
Our blended model is getting close to the important reading of 95 as we currently sit at 94.50. As we discussed, a 95 reading is not a binary level (all or nothing). It should only be used as a historical reference as to where the S&P 500 does not provide the best risk to reward.
I do think the S&P 500 index can possibly test 4,130 before the index sees any meaningful retracement. However, we can’t time the market. As we mentioned, prudent profit taking at a 95 or above reading is warranted, especially in the following sectors: Financials, Industrials, Materials.
Let me state, from my historically point of view, when the S&P 500 model is overbought at a 95 reading, typically there is a new catalyst that causes a sell off. These catalysts are usually met with a buying opportunity after a 7% to 8% decline. The only recent 95 reading in recent memory that was not met with buying would have been January 23, 2020 for obvious reasons.
S&P 500 Proprietary Model
Click image to enlarge

Today we had the Fed minutes and surprisingly the markets experienced little volatility as the preceding Fed days. As we mentioned in previous posts, bond yields seemed to have peaked in the short term as AGG (iShares aggregate ETF) is extremely oversold. But make no mistake, even if the 10-Year Yield retraced to 1.46% and the NASDAQ tested 14,000, I would be a seller of high multiple technology as the long term trend is up.
As mentioned in our last post, this short term oversold condition in bonds would be a short-term positive for a counter trend rally in the NASDAQ and high growth stocks. However, the long term trend for yields is up. Unless the recovery completely falters, the NASDAQ will be challenged. In our last commentary we said 14,000 on the NASDAQ seemed likely.
Furthermore, as we mentioned in last Friday’s email, growth at a reasonable price like FB – Facebook will be less negatively impacted by rising rates than higher multiple names. If you did not look at factors that I consider to be growth at a reasonable price, please see the bottom of this email.
Rating Value FB: Not a recommendation
As discussed in the commentary on March 19th, FB – Facebook looked like it was set up to make new all time highs. Note: this is not a recommendation. We are strictly for demonstration purposes on what we like to look for with our models. FB’s rapidly increased from a strong sell (rating Value -64) to a buy. Additionally the counter trend was slightly oversold at a 4. We liked how the stock rapidly increased to a buy off a slightly oversold counter trend and a sell rating value. This meant shorts were still in the stock and medium term longs were not involved in the stock.
Click to enlarge

Friday, April 2nd
Friday’s jobs number was a blowout, with the economy adding slightly over 900k new jobs. However, this was not a surprise as the whisper number was that it was going to be a blowout. The reaction in the futures was exactly as you would expect:
- The S&P 500 futures on Friday traded to our target of 4,030, gaining 17 handles.
- The Russell jumped almost 2% as small caps were bid hard as the reopening trade was back on.
- NASDAQ only climbed .21% or 28 handles as the 10 year yield jumped tp 1.724%.
Our S&P 500 View
Now that we hit our target, what now? Well our S&P 500 blended model is now reading a 91 and there is a high probability that it will see 95. Remember, we want to de-risk our portfolios at or close to a 95. This means different things for every investor. Some of you will raise cash, some will write covered calls or buy puts to hedge, but the main take away is to reduce risk.
Statistic: 88% of the time since 1992 when the model hits a 95 the S&P 500 corrects on average 7.5%.
Ways to De-risk:
- Reducing the most overbought sectors (check our counter trend). Currently, financials are the most overbought and pulling forward a massive assumption on future expectation that Net Interest Margin will expand.
- Reduce most overbought stocks by reviewing the counter trend for each stock.
- Sell your highest beta stocks is a good way to reduce risk.
- Reduce stocks with the greatest momentum (just look at what has the greatest 12 or 6 month returns).
Now its possible that we never get to a 95 or move above this reading. Nothing can be that exact, but our process is to manage risk. We want to raise cash and wait for a pullback to redeploy that capital. In the second chart below you can see the complete historical data of the S&P 500 model.
NOTE: IF the S&P 500 got to a 95 that could easily take the S&P 500 to 4,100.

Click image to enlarge

NASDAQ
Since November, we have been sellers or avoiding technology as we saw rates breaking out. Selling into the NASDAQ as referenced below by QQQ when the CT (counter trend) was in the -70’s was warranted.
On Thursday, the NASDAQ closed well above the 50% retracement of 13,220 we were looking to reduce any further exposure to high multiple tech names. That move was very bullish. The index closed at 13,334 and our rating value had a nice move from a .14 to .50. What was bullish was the rating value was consolidating at .14 for 3 weeks.

NASDAQ levels to watch
- There is a little resistance at 13,450, but after that you could easy retest the old highs of 14,000.
- However, I am still not a fan of the NASDAQ as I do think the stronger the recovery gets (i.e. jobs), rates are going higher, like we saw on Friday.
Factor Based Quants
It’s important to understand what drives the market today is very different than a decade ago. Quants are moving the markets in an unprecedented manner and there are many different types of quants. One type of quant that is currently impacting the market is factor based quants. These quants will buy and sell based on fundamental factors.
As rates rise they will sell higher multiple names faster than growth names at a reasonable value. Now remember from previous conversations and commentary, not all tech will struggle in a higher rate environment. Growth at a reasonable price will hold up relatively well in comparison to stocks that have climbed over the last year on multiple expansion. As I have mentioned on calls and in the commentary, the factors I look at for with “growth at a reasonable price”, as well as other factor based quants are the following:
- ROE (Return on equity) needs to be higher than 19%
- Enterprise value to EBITA less than 30/40
- Price to sale 14 to 15
- Multiple no greater than 2 X EBITA Growth rate
- Avoid multiples that are 3 times or greater than EBTIDA growth rate (example, if a stock is trading at a 30 forward PE and only growing earnings at 10 times). An example of this would be MSFT is trading at a 36 times forward PE and Growth EBITA by 17%. Apple however is trading at 33 times forward earnings but growing EBITA by 9%. Now I am not making a recommendation, what I am is showing here is 2 growth stocks that are trading at similar PE’s but MSFT is growth earnings by a larger %.
Again, this is more of an exercise in risk management, because when you do get a pullback based on higher rates the market will be more punishing to stocks that have higher multiples and less supportive growth.
As for the NASDAQ, tech is not an area I am looking to add unless there is a large catalyst of declining yields, a 3 to 5 rating value jump. The only thing I will say as a contrarian point of view are bonds are very oversold. As we pointed out last week, the AGG ETF has a counter trend of +50. So if the 10 year can’t break out above 1.75, the NASDAQ could find some legs to its all time highs.

March 31 – Mid Morning
Looks like all the quarter end Pension and momentum (tech) rebalancing selling as been finished as we highlighted last week. I am still a sell of higher multiple tech at 13,220 as I have been saying for weeks. I still see the S&P hitting resistance at 4,030, but for another 1.50% that doesn’t seem like a great trade. Financials are so stretch , I see little upside at this juncture. The infrastructure trade has been played for months. But you maybe get a little upside with industrials and materials and some energy. Additionally, small caps measured by IWM/Russell have peaked. However, there will be a trade here once the Russell gets some further washout. I remain neutral on any long opportunities at the current juncture based on our rating value. On a fundamental view point, I don’t think the market is remotely pricing in higher taxes. This will certainly impede growth and contract multiples. Remember you don’t always need to make a trade and be 100% invested.
Also, your email and home page alerts will not populate unless you create a portfolio as seen below. So make sure you add a portfolio.
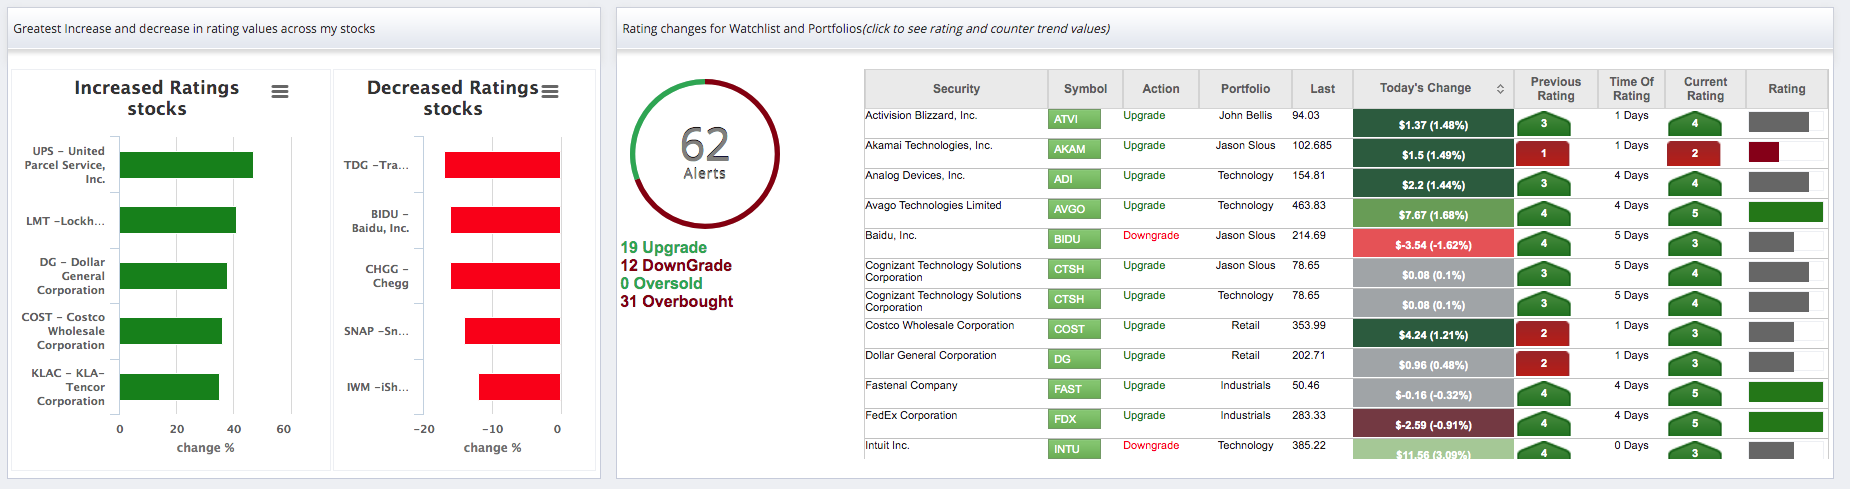
March 30 – Pre MARKET
This morning we have the 10 year making new annual highs up 2.50% reaching 1.77%. This is a big level, a breakout here will take you to 2%. Again, some times the best investing or trading is to do nothing and wait for a better set up. Not to sound like a broken record, I do not like anything in this market or setup. As seen believe we are really starting to see declining participation within the breadth of the S&P 500. While this is not a reason alone to be bearish, it is evidence that the S&P may struggle to move higher at with the current level of participation.
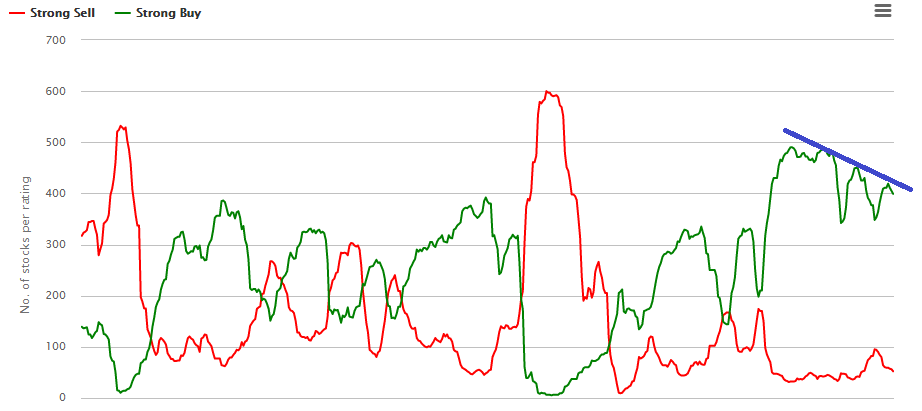
March 29 – Post MARKET
For several days we have been saying we have not like the set up. I think the market has been trading terribly under the surface, even if the S&P 500 close Friday at al time highs. For newer members, something that I always say is don’t force a trace and let the market come to you. While valuations have been stretched for well over 12 months and often times massively overbought.
For now I do not like the set up on any indexes.
March 26 – Post MARKET
On the surface the indexes have seen the worst of the rebalance selling dry up in my opinion. As I said yesterday, this seemed like the logical cause as it was so hyped up for the last 3 weeks. However, that doesn’t mean the set up at this juncture is a good one to get long. I still think 4,030 is likely on the S&P 500 before any failure. The S&P diversification has really helped keep the index almost in neutral for the last few weeks. A close above 3,950 on the S & P will take the index to that 4,030 level. Although, to get long SPY for a little 2% is not worth the risk. I also like the equal weight S&P 500 ETF instead of the cap weighted as SPY is too heavy in AAPL, TSLA, MSFT, GOOGL and AMZN.
- As of now I still think any rally on the NASDAQ to 1,3220 tech should be sold unless it falls into the value camp.
Additionally, I don’t like to see a dozen stocks down 30% to 50% in 1 day on no fundamental news or catalyst. This can be very disruptive to the markets confidence.
- DISCA at one point fell 41% to trade as low as $34.60, the stock was trading at $80 last month.
- VIAC at one point was down 40%
- GSX down 50%
DISCA is a perfect example of way too much risk and also a great trade. Click to enlarge.
- These are my favorite long trades, they start at a strong sell (rating value less than -70 and consecutive build strength to a strong buy less than 3 weeks. However, the stock should no longer be owned with a CT (counter trend less than -80 or -88 if your really aggressive. Now, what happen in the last few weeks of being sliced in half is really not company or fundamental specific. We truly as of today, don’t know the true story, which we will soon. However, a counter trend of less than -88 you are playing with fire after a 300% return.
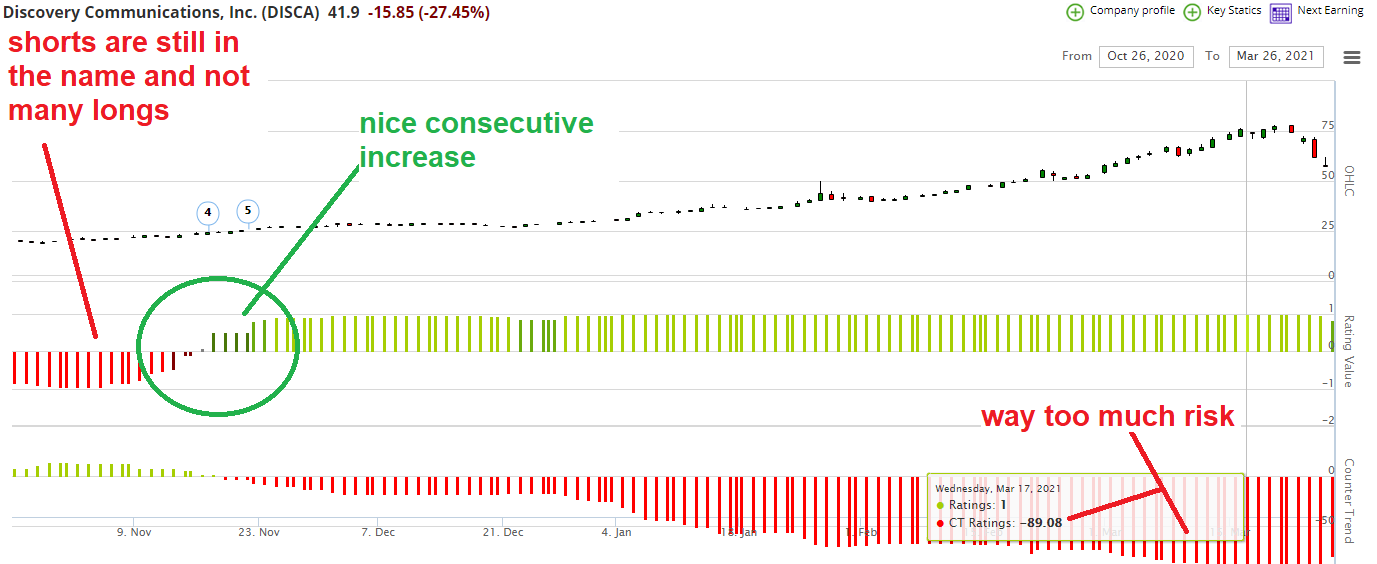
I have no opinion of recommendation these stocks, purely an observation of large forced block selling by an unknown fund.
March 25 – Post MARKET
Very nice bounce for the Russell which hit a low of around 2091. As we discussed previously, we thought 2075 was a level that would have been supported and if not 2030 would have been the line in the sand.
- I still believe by looking at the price action, this recent weakness in the indexes was a result purely from both pension fund and momentum rebalances. Hedge fund managers have been front running this rotation for weeks. Now we need to see if the selling dry’s up on the NASDAQ tomorrow. I still do not like technology yet; however, there will be an oversold bounce at some point.
- The 7 year Treasury had a weak auction today, which sent the 10 year up 2% into the close, thus pressuring financials.
- Below you have a weekly chart of the 10 year yield. It will take a tremendous amount of selling for yields to take out this level and hit 1.90%. Anything is possible, but I think yields might consolidate right here unless you keep getting terrible auctions.
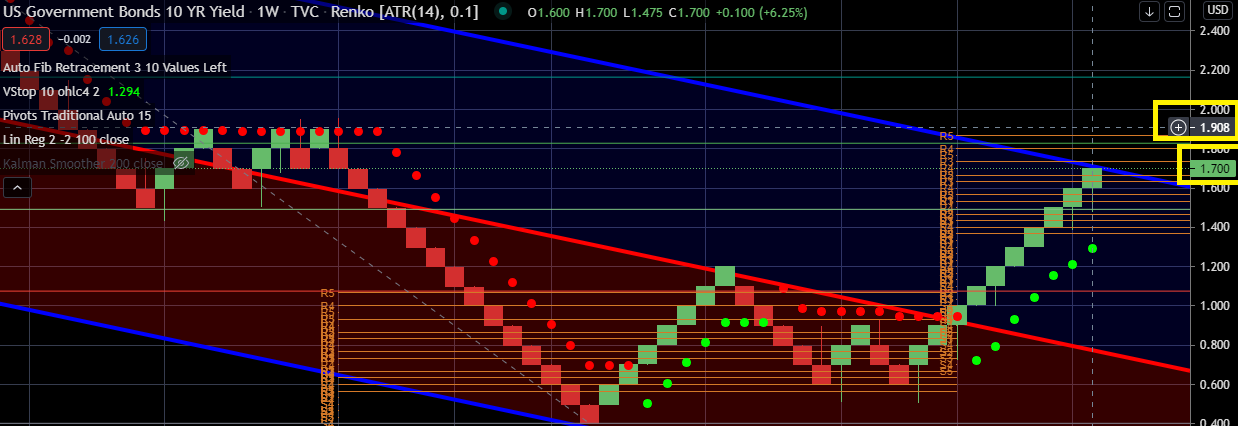
March 25 – Pre MARKET
Another ugly morning for the Russell, futures down, 1% trading at 2108, I think 2075 is in the cards. Not sure if we can hold that level or not, we will have to wait and see. As we have been saying, I see nothing in terms of sectors of indexes that are appealing yet. I do think once the quarter end rebalancing is over we will see some buyers step back into equities.
The line in the sand for the Russell is just about 2,030, we do not want to see the index close below this level.
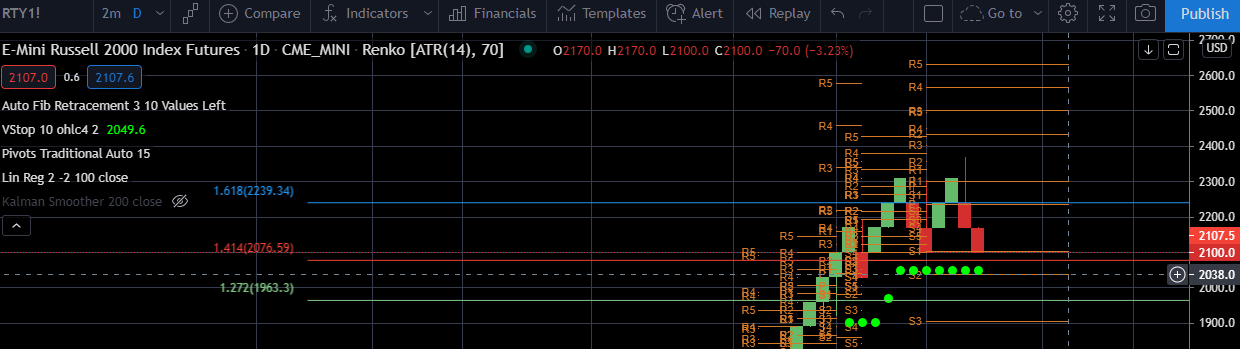
March 24 – Post MARKET
I still don’t like the set up at these levels on any index or sector.
- What a terrible day for the Russell, a 4% reversal. A lot of the selling is quarter pension fund rebalancing, the question is when will the selling dry up. By the way hedge funds know this game, they sell the rallies into the end of the quarter. There is no economic or macro catalyst other then this reason.
- As we said yesterday we felt the Russell would test 2,075. That would be close to a 11% correction in 10 days. I don’t like catching falling markets, as a trend follower that is not our approach, but if the Russell does bounce, that is a starting point of the recovery.
- As for the NASDAQ, my longer term view hasn’t changed and I thought for weeks if not months we would have a retest of 12,300. The S&P 500 still remains steady as it is the most diversified index.
- As JPMorgan reported, there is about $70 billion for sale in pension rebalancing. However, the selling never occurs the last few days of the quarter and typically is dry’s up prior to the last day or two. The only issue is does the rebalancing cause too much technical damage before we can stabilize soon.
- I think a massive down open tomorrow would be bought. Yet, I think the futures will attempt to recover and fall again as selling continues tomorrow. If the market opened down 1.5% to 2% that would take us to the levels above and would make for a decent intra day.
March 24 – Pre MARKET
Not much happening in the way of news today. Futures are rallying, with the Russell leading the way after that big sell off in small caps yesterday. As for the S&P 500 the rating value is still very strong and steady. Although the CT (counter Trend) in red is a -67.79 and is just about overbought. I see limited upside; however, 4,000 on the index seems likely before any significant correction.
In comparison, the RUSSELL (IWM) was massively overbought, the index hit a -90 CT (counter Trend) in the past cycle rally as seen below. Any stock and especially an index that hits a -90 should be reduced in exposure. The risk of a pullback is significant where the upside is limited. Typically, these massively overbought counter trends take months to work off the excess and correct. However, once there is a correction, it will be time to get long the index. Currently, the index is not yet ready to reload to the long side. 
Lets take DE as an example of being massive overbought with a -93 rating during this recent rally. If an investor bought this stock at a Strong Buy (5 rating) and now has reach a -90 what is the rational for holding it longer? Tax implications? Stocks that reach such extreme levels historically see mean reversion and have limited upside. Always manage your risk and don’t be emotional.
As for the 10 year yield that is up .50%. However, AGG is massively oversold, so a little more rally in bonds is logical.
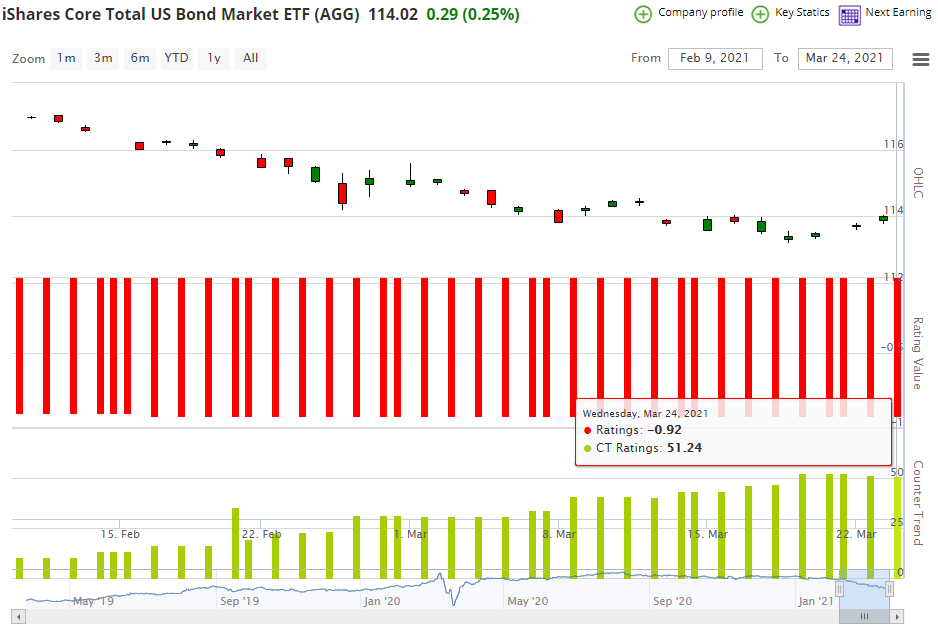
March 23 – Post MARKET
Today we saw a massive rotation as we discussed yesterday that may play out. The Russell (small caps) at one point were down -4.15% vs. the NASDAQ -.36%.
Few catalysts for todays small cap destruction.
A. Rally in bonds across different durations, as we been discussing as the AGG (iShares aggregate) CT was a +50 which is massively oversold. As we said yesterday, this wont be a long term trend but a shorter term counter trend rally.
B. The historically variance of value/small cap vs. growth hit the upper channel of the sloping channel that we discussed yesterday.
C. Powell and Yellen talked down long term inflation implications. I have seen this before where the next day, the market reverses course. We will see tomorrow if all inflationary trades recover!
As for the NASDAQ it got close to the 13,220 level of 13,178 before failing. I still think all tech rallies should be sold. I would like to see if the Russell can find a bottom at 2,075 to bounce; however, the small cap stocks are still so massively overvalued.
March 23rd – PRE MARKET
Not much to discuss this morning except we have a small unwind of yields as Europe is seeing some increased cases of COVID. As mentioned yesterday, this will give a boost to the NASDAQ in the very short term, but unless you are swing trading, I am still not constructive on technology.
Powell and Yellen speak today which will move the market.
March 22nd – POST MARKET
Currently I find nothing of interest in terms of sectors or asset classes and that means stocks as well. Today’s rally in the NASDAQ in my opinion is nothing more than some short term reversion to the mean when comparing Growth (QQQ) vs. Small (Russell) Caps as seen below. You might have a little more to go as the Russell is massively overbought, but the trend medium and longer term has not changed.
As long term members know, when there are no great opportunities, doing nothing is best. Do not get caught up in the fear of missing out.
This chart represents Long QQQ short IWM, as we can see long QQQ and short IWM broke the long term channel and the variance was the widest it has been in 13 months. Meaning the NASDAQ was most oversold to small caps in 13 months. These type of moves will always get a snap back to a certain degree that don’t last too long.
Another interesting view is the weekly Long QQQ short IWM. August 2020 was almost the exact double top back QQQ saw in August 2000. I wouldn’t read to much into this except the trade broke a key level on Jan 2021 and I don’t think this regime change is over yet. However, the Russell needs to correct to washout weaker longs.
March 22nd – PRE MARKET
I would not be surprised to see a little rally in bonds as AGG is massively oversold with a counter trend of +50. This will help the NASDAQ to get a boost, but I would not fall into the trap as the 10% year yield declines. I would use this as an opportunity to sell into 13,220 on the NASDAQ. Unless the index can significantly close above this level, I see limited upside.
For those of you who look at fundamentals, stocks with lower forward PE and solid growth rates will hold up much better.
For example: a stock trading at 25 times forward PE with a earnings growth rate of 18, will do much better in a rising rate environment than a stock that is trading at 20 times forward PE with a 10 earning growth rate. These stocks that had the great multiple expansion from low rates are, in my opinion not going to see their multiples expand again.
I would like to see small caps, financials, industrials and early stage pro cycle stocks pullback more to reallocate for a back half of the year rally. They have moved too far too fast.
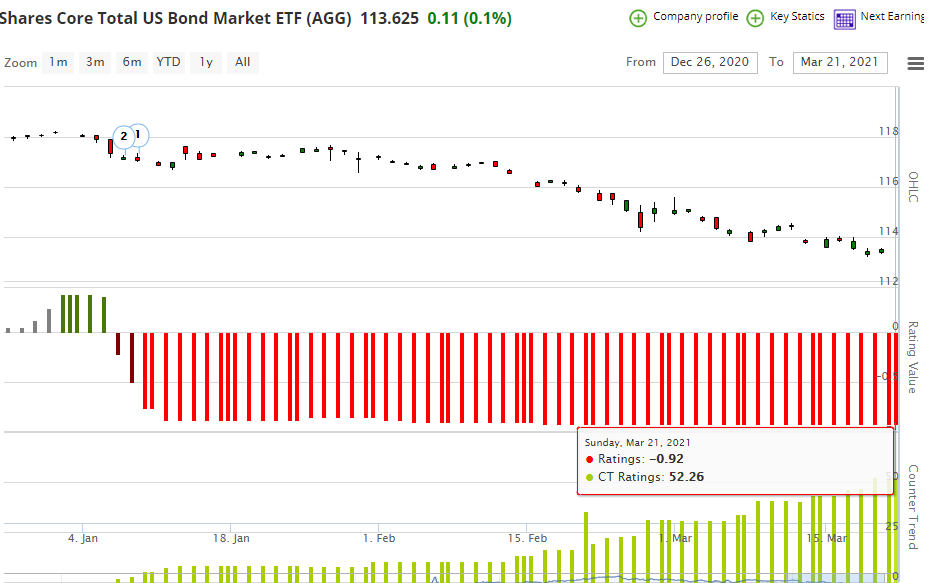
Note:
We fixed the heatmap on the chart page!
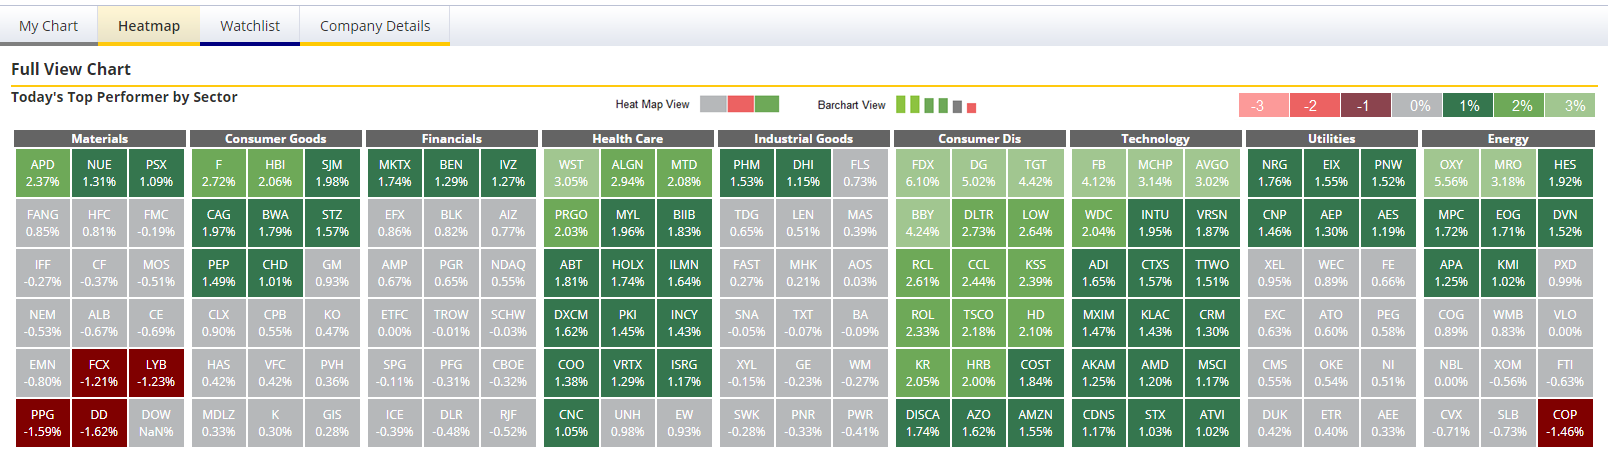
March 19th
Facebook, this is purely for an illustration not a recommendation to buy or sell as we rarely discuss individual stocks. We currently do not own this stock. But for new members I wanted to point something out here. Facebook just moved to a strong buy and is still a positive counter trend meaning it is under owned and slight oversold, yes oversold. This mean that the shorts are still in the name and need to cover helping it breakout. While we don’t look at fundamentals, this stock is very cheap compared to an Apple, its PE is 22 forward times while its growing earning 18 to 20 times. So if rates keep rising it wont be hit as badly as higher multiple stocks with less growth.
Again, I am not suggesting this is a buy as we do not make recommendations. But it seems like the rating value could take it to new highs.
March 19th
Premark
- Today is adult swim as you have a lot of rebalancing and quad witching not a day to make investment decisions.
- The Fed just announced it will not extended SLR for the banks and this is important for 2 reasons. First that means the banks capital requirements will be tightened which means their ROE (return on equity) will go down as they wont have as much balance sheet leverage. The second is that all the excess capital that they had will be coming out of the treasury market maybe pushing yield back up as their are hundreds of billions in capital. Avoid this sector for now.
March 18th
Post Market
- To reiterate for newer members, we will let you know when the coast is clear to get back into the NASDAQ. We have been bearish on the NASDAQ for several months. Now tomorrow, we have a very big quarterly rebalance tomorrow for the momentum factor. I can not measure/quantify the impact this will have on the NASDAQ, however, it will be negative. JPMorgan estimates energy has $10 billion of rotation into Energy and industrials alone, while tech will be sold.
- Chart 1 seen below: Why will there be a big rotation in momentum after a few year? Well as we know momentum is calculated by looking at both the 6 and 12 month past returns. Many factor based funds sell the lowest rated momentum stocks and buy the highest in the index. Take for example Apple in Green and Exxon in Pink 6 month returns. For the first time in a year or two has leadership in terms of momentum changed this much. So many factor based funds will sell Apple and buy Exxon blindly.
- S&P 500 said Apple has 40 million shares for sale in part of their rebalance process. Now, many traders know this and tried to front run this. However, regardless this will cause selling pressure into the close tomorrow.
- The Nasdaq has support at 12,372, however, unless your extremely short term and nimble for a day trade, I am not sure this is the level longer term buyers want to go long.
- We also said we are not buyers of anything while the blended S&P 500 model is sitting at 90, so today we were sitting on our hands.
- Chart 2 seen below: Additionally, we said never in the last 30 years have financials been more overbought and selling into todays strength was logically.
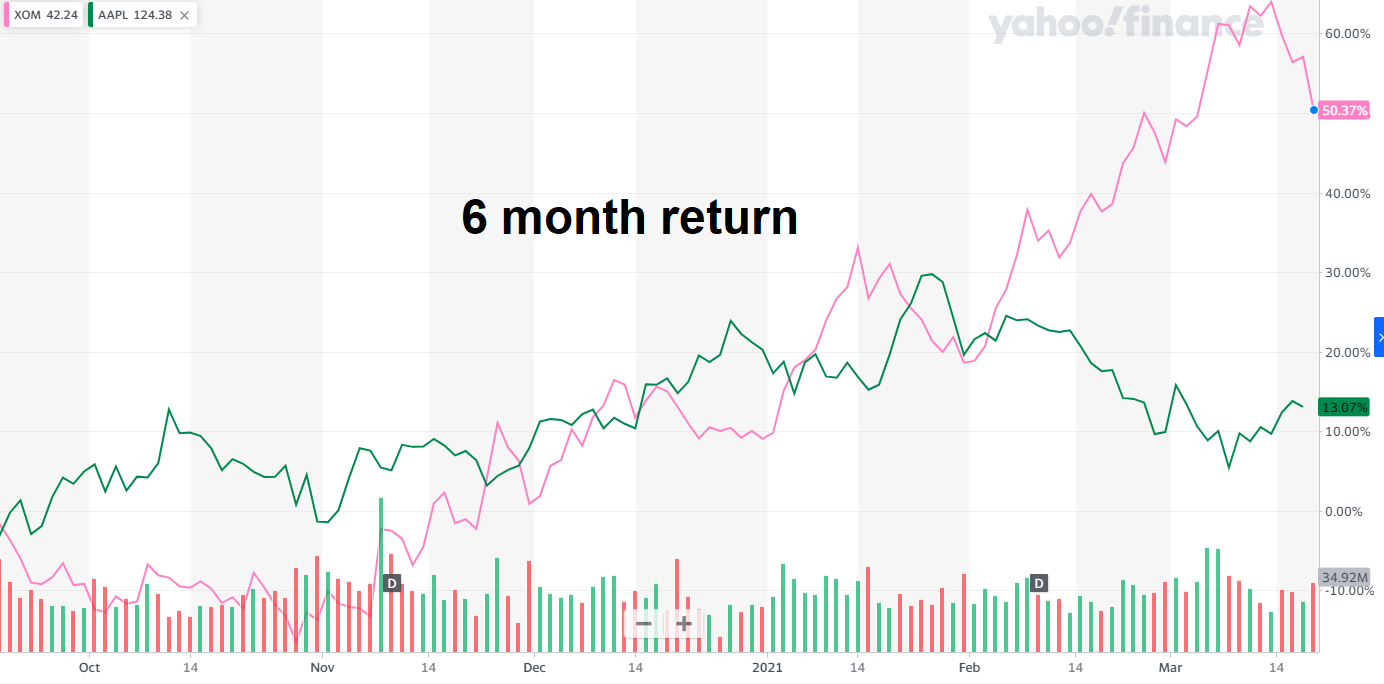
We went to a Strong Buy (5 Rating) in XLF back on Nov 9th and the counter trend model is now a -80. Unless the 10 year yield takes out 1.85%, reduce exposure.
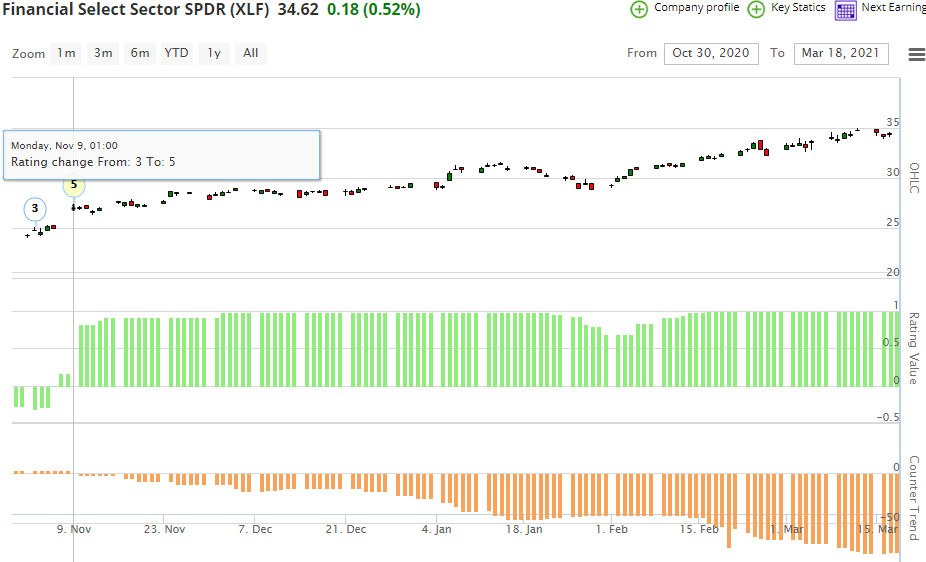
For new members, remember, we do not want to add to longs once the blended S&P 500 model reaches a 90 and we want to reduce long exposure at 95. See Market internals page to see full data. 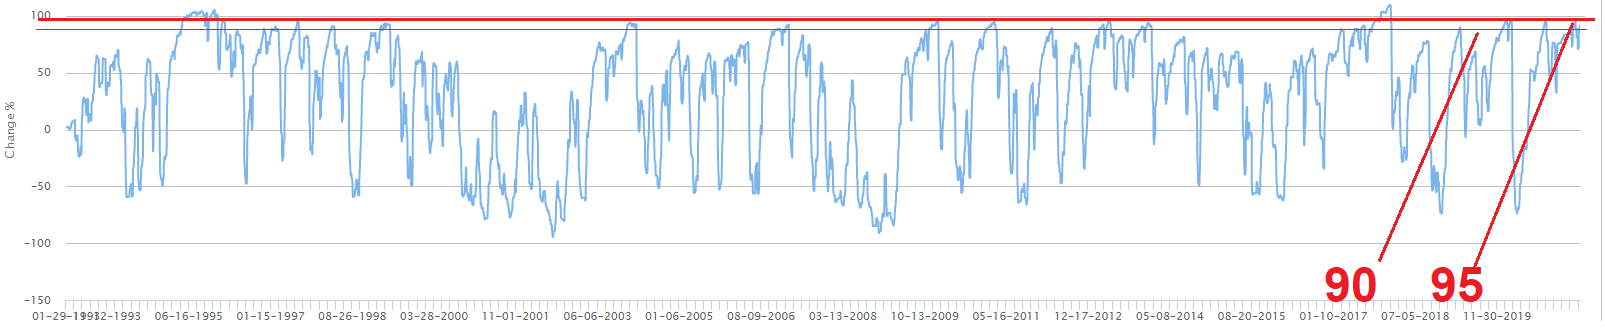
- We also have been bullish on the Russell since Oct since moving to a Strong Buy (5 rating). However, the Russell has never been this overbought since its inception. Once this overbought condition is removed, we will want to reengaged to the long side.
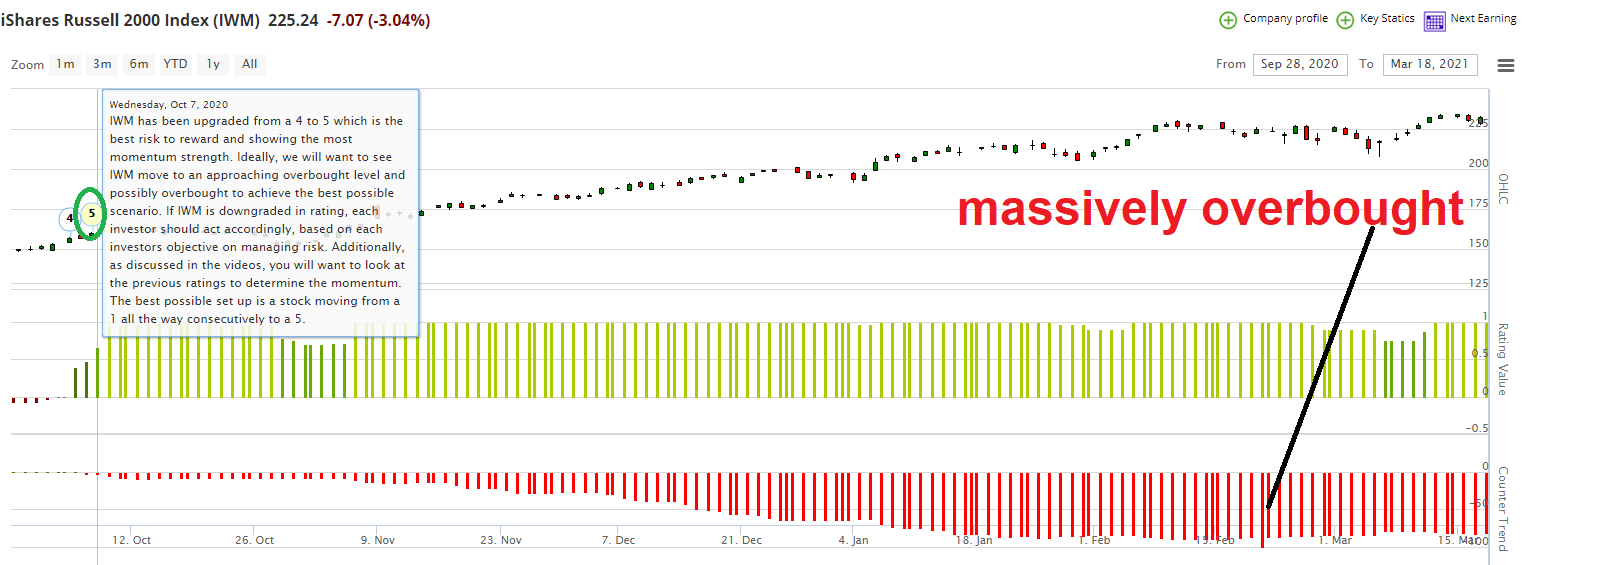
March 18th
Premarket
Today we finally hit our 1.75% target we have been looking for a few months on the 10 year yield. We have been saying since Nov 2020, this was going to cause multiple compression in high multiple tech.
So can it be this easy to once again to buy the NASDAQ that has held up well. Surprisingly the NASDAQ has held up rather well as the 10 year yield has risen .75% in 2 months. Only off 6.5%.
I think today is an opportunity to reduce financials.
March 17th
- It seemed that almost everyone on Wall Street calling to see at least 1 rate hike in 2023 on the dot plot was wrong. This is part of the reason rates jumped to almost 1.70% this morning. However: the median remained unchanged and help sooth the markets… kind of!
- The NASDAQ in my opinion, was exceptionally strong at the open even though it was down 180 points and the 10 year yield spiked 3.90%, reaching a high of 1.685%. The worse of the tech selling may be over, however, that does not mean there is a lot of upside in these names. I actually still don’t want to own them right here.
- The 10 year reversed almost 3.90% after Powell said he was comfortable with negative rates, which was very interesting. Additionally, he said he would address SLR in a few days. If you recall, SLR is something investors / the market is something they wanted Powell to address. SLR stands for Supplementary Liquidity Ratio, which is a constraint for banks to retain more treasury’s, reserves and deposits that will provide more liquidity. I personally have no idea if this makes enough difference, but more liquidity is certainly a reason for higher prices.
- I think making investment decisions or trading on big fed days are always impossible, as the market changes its mind the following day.
- I am cautious on financials right here and tech, however, energy on dips might still be bought as you are getting a momentum rebalance at the end of the month ,which will help hold up the sector.
March 16th
- NASDAQ went slightly above our 13,220 target to 13,283 before rates reversed and caused some selling on the index, to close at 13,150.
- The 10 year could not stay down 1% and reversed to close up .23% at 1.621%. However, the NASDAQ still was relatively strong. Not even a very good 20 year auction could keep rates down today.
- Small cap’s were hit hard along with energy, financials, industrials and materials. This is nothing more than these sectors seeing profit taking off very extended levels.
- Tomorrow you have Powell speaking and I think the market will be disappointed regardless when it comes to rates.
- Caution is warranted.
- XLF – Financials since its inception has never been as low on the counter trend -80 as now. as you know lower = overbought. I am not saying a correction is eminent but caution in this sector should be warranted.
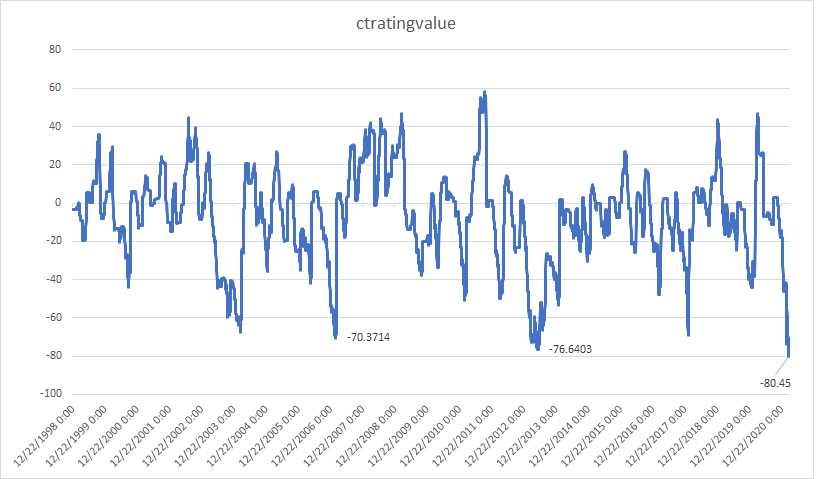
March 15th
Slow day in the markets. The NASDAQ found some reprieve as the 10 year yield failed to move higher. However, as we said last week, 13,220 on the NASDAQ is a level we are selling technology. As for the S&P 500 as we mentioned last week, 4,020 seems probable. The blended S&P 500 model is now 88 and would expect to see at least a 92 if not 95 at which point I would be reducing equity exposure. The only thing that could pressure the index is a pullback in financials it the 10 years reversed to its breakout level of 1.25. Financials as measured by XLF is really overbought at this level. However, I do not see the 10 year moving back to 1.25% any time soon.
Tomorrow we have retail sales which will be a driver for the Russell and consumer cyclicals. Bank of America was out with a note saying they expect a much weaker number. The question is will this be overlooked and any dip in retail be bought…
March 12th
The Close
Surprisingly the NASDAQ was actually very strong today even though it closed down 108 points. The 10 year yield traded up 5.35% to 1.625%. I would have expected a weaker close. Now next week we have quarter end balancing on the momentum factor and expect this to cause additional pressure on technology as almost all tech is in the highest momentum scoring.
Not much else to report, I expect the same themes to continue for the short term, however financials and energy are getting a little extended here.
Premarket
Do not be tempted to buy todays dip in tech, the 10 year is at a vantage point here almost 1.62. Either is falls and the NASDAQ will stabilize or its going to breakout. I do believe it will see 1.75 in short order over the next few weeks.
March 11th
Today the reinflation trade took a breather as the NASDAQ ripped higher. However, the NASDAQ failed to close above the 13,220 level we discussed in prior days. The index is now 7% from its all time highs yet, the RUSSELL and S&P 500 closed at all time highs. I am still a seller of the NASDAQ and like the reinflation sectors. However, XLF and XLE are slightly overbought so I am not a buyer here. We have been bullish in the Russell for months and take a little off is not a terrible idea. However, in the longer term that reopening trade has legs higher.
As for the S&P 500, 4,020 seems like the logical next stop.
As for the NASDAQ you can see the 13,220 level I am referring to. 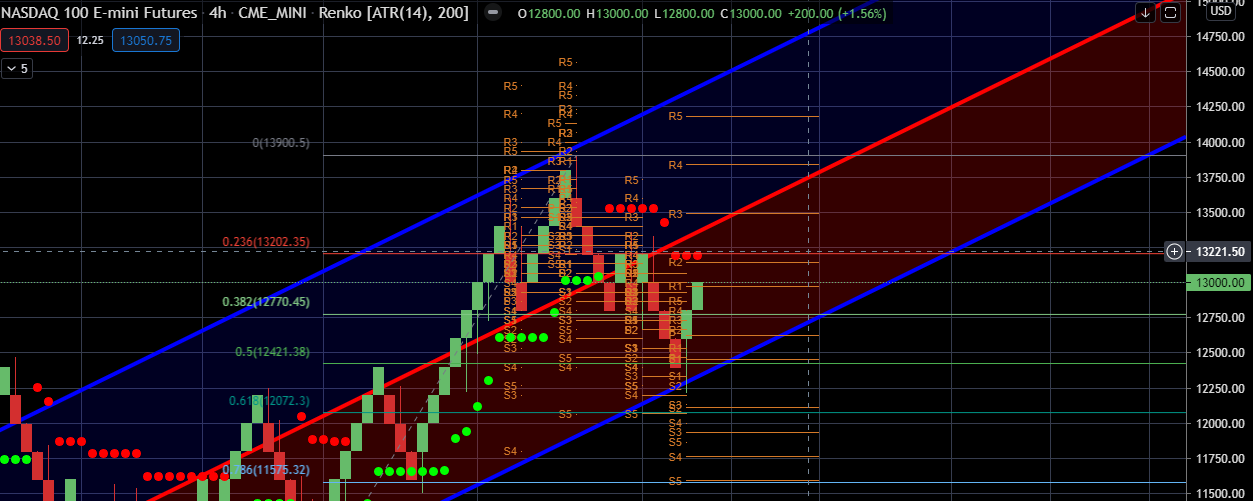
March 10th
So the CPI came in line, if you really believe the number, which I do not believe on what the BLS stated. As reported by Zerohedge: The BLS is basically just admitted it is all BS…“data collection in February was affected by the temporary closing or limited operations of certain types of establishments. These factors resulted in an increase in the number of prices considered temporarily available and imputed”
However, as I mentioned if the number was perceived to be good you would get a massive rally of 500 points. However, that was before the NASDAQ was up 500 yesterday. 13,220 is the next major level of the NASDAQ, in which case I would reduce technology holding. We have a 10 year auction today, this will be important for tech. IF demand is strong tech will rally even further today.
March 9th
Very impressive, but machine driven rally off the back of a 4% lower yield on the 10 year. Do I think today was really buyers, no! I don think this rotation is done yet, however, that’s not to say we wont get some mean reversion in the reinflation trade and tech. The NASDAQ (futures) needs to close above 13,230 to really get back on solid footing to make an attempt at its old highs. Unless rates take a meaningful move lower, I find it hard to believe this will happen in the short term.
As mentioned, tomorrow has a big catalyst in CPI. That will dictate the next move in the NASDAQ.
March 8th
Today was rather painful for the NASDAQ, at this juncture everyone has had the chance to reduce tech exposure as we have been saying for months. The NASDAQ is not oversold yet, to get to an oversold level you would need to see about 11,500 on the NASDAQ futures. I am not saying we get there, I don’t try to predict how low indexes go!
I expect Wednesday to be a monster move for technology as CPI will be reported. If the number comes in hotter than expected the NASDAQ will get killed. If CPI comes in much lighter, we will see an up 500 point day.
Don’t make the mistake like many investors fall into historical bias. What worked so well in the past does not mean it have to continue to recover. To put this in perspective, we always discuss Apple. Apple for the last decade grew earnings at 8 to 10 times and traded at 8 to 10 times earnings. When Apple traded $135 it was still growing earnings at 9 times yet was trading at 35 times earnings. This multiple expansion is only because of low rates. There is no reason Apple cant trade at historical multiples if the 10 year yield normalizes back to 2% and above.
The other reason, we are getting a continued rotation is quarterly rebalancing of the momentum factor. Remember, momentum is calculated blending 6 and 12 month returns. This means momentum funds that have been long Apple, NVDA, GOOG and all the 12 month best performing names are know longer in the top quartile. As these names fallout of the top quartile they are sold and replaced with the new quartile stocks.
Lastly, do not listen to talking heads on TV that say rising yields are just fine for the market!
March 5th
Friday we had a massive rally off the Russell’s lows and an impressive rally off the NASDAQ. The Russell had a 7% round trip. My opinion sill is stead fast, sell technology now on any rally, the sector is going to be challenged as real rates are going higher. I still think pro-growth cyclical stocks along with energy will work for the foreseeable future. The S&P 500 model is now at a 70, rarely do we reverse from a 92 or greater and fall only to a 70 reading. So I do expect volatility to remain.
The good news for the NASDAQ as seen in QQQ the Counter trend is now a -6 and worked off a tremendous overbought -77 level. The bad news is historically the rating value does continue to weaken from its current .29 reading after being overbought. The only positive thing the NASDAQ has going for it is the Semiconductor strength, but I expect this to be short lived once the supply chain disruption is over.
I do believe as I have for many months, higher rates are a real game changer for higher multiple stocks.
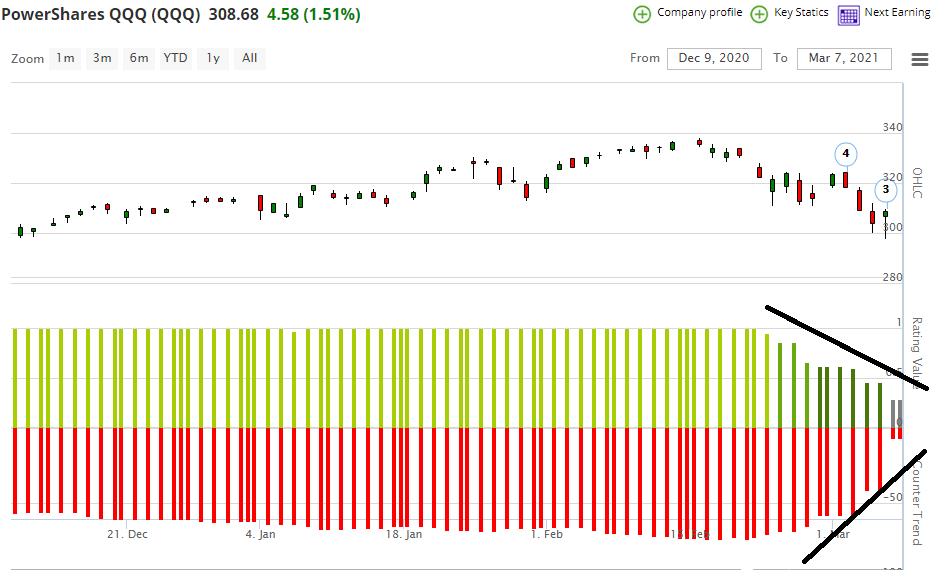
If you have a high level of cash and feel the need to put capital to work, stick with stocks that rating values are increase of CT that are still declining. This is what the scenario would look like.
As we have mention for several months would be the best sector play for higher rates. XLE is now a -62 counter trend not yet overbought and $53.88 is a massive level it needs to get over and close. A close above this level, XLE will run further. But keep watching the CT (counter trend for extreme overbought levels)
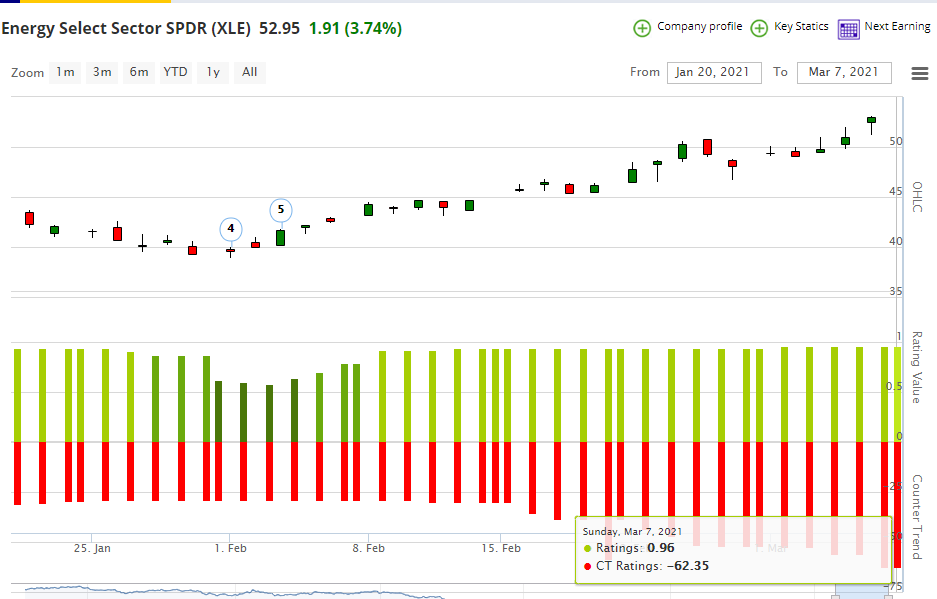
March 3rd
So today was rather ugly. We last said we expected the 10 year to retest 1.27% and tech bounce at which point I would be a seller. Well tech bounced on a small decline in rates but not 1.27%. Many of you should have had plenty of opportunity to sell into Mondays rally. We haven’t seen anything yet with these high multiple names if rates really do breakout. Anyway, I am still avoid tech here and waiting for a much better level to reengage.
Maybe tech bounces tomorrow, but another up 250 to 300 points on the NASDAQ I am selling.
Feb 28th
What I am watching for the week to come. I expect to see the 10 year yield to retest 1.27% and tech possible rally a little which I would be a seller. I think the 10 year yield will bounce off the 1.275% level back to 1.50% and cause more pressure on tech. I expect the Fed to really start jawboning this issue of higher yields, but I think it will ultimately have little effect as rates ultimate will rise to 1.70% as the economy reopens fully.
One of the biggest poster child of multiple expansion and not earnings expansion is Apple, as seen in the second chart, Apple is starting to take out almost a 10 year upper trend line. I think for investors who haven’t seen a rising rate tech rotation are going to cause some panic with running for the exits.
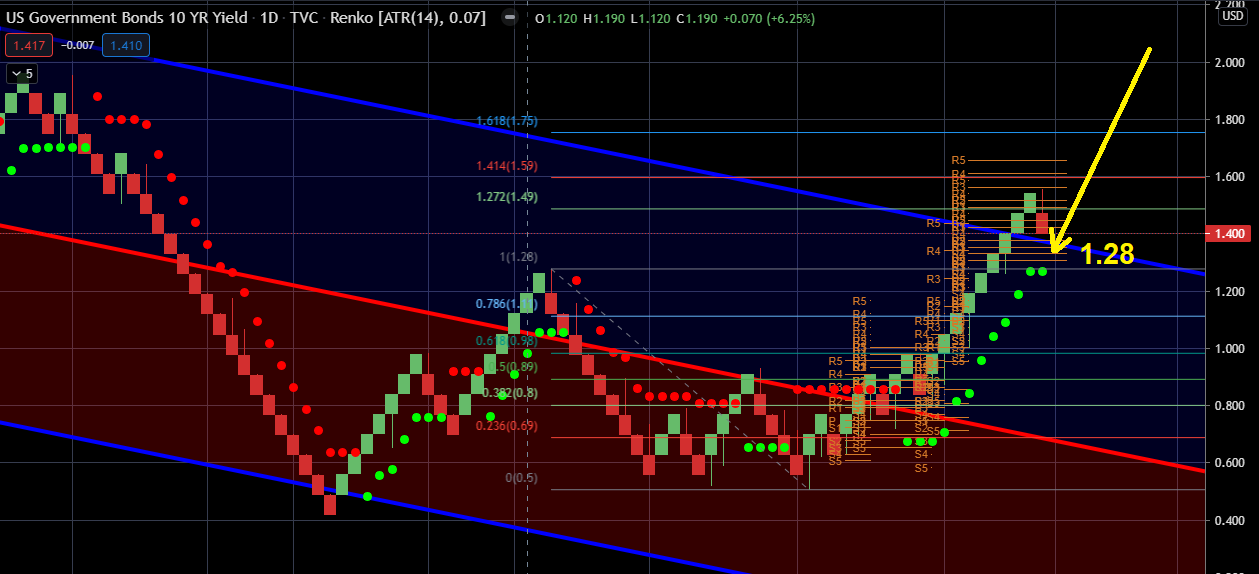
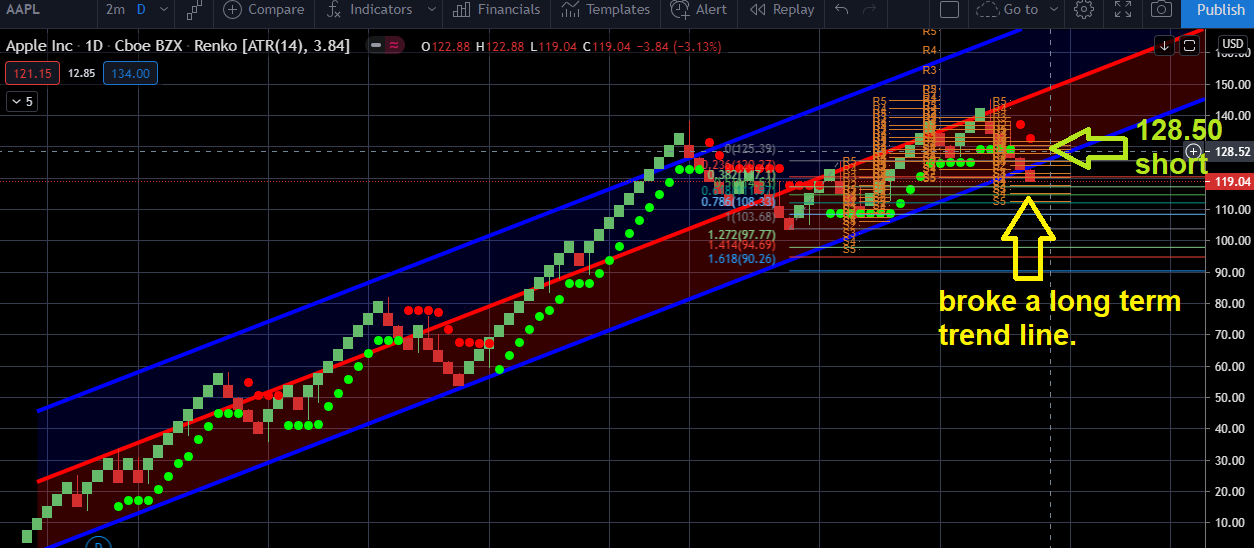
Feb 25th
So today felt bad understandably. But this we saw coming from a mile away for weeks. I still don’t think there is an opportunity yet to get long anything. As we have said, I am not watching levels on the equity index’s, only rates. I would like to see the 10 year yield consolidate here, but doubt that is going to happen. The next big resistance level is 1.599%, if we close above that level, we are in for a lot of pain as the next level is 1.75%. If rates did test 1.75%, I would think that would bring some opportunity to get long equities.
Amazing, all those investment talking heads who have been saying for months they weren’t concerned with a 1.50% 10 year yield as it must mean the economy is getting heathier! That maybe true, but equity risk premium will contract as yields rise regardless.
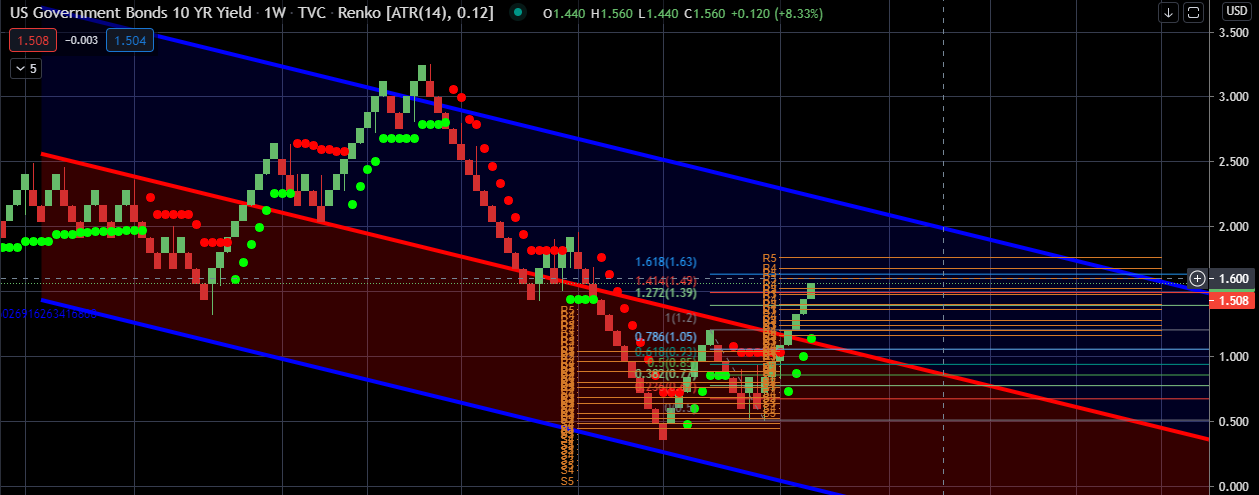
Feb 23rd
Impressive close for the S&P 500 and NASDAQ. However, the NASDAQ couldn’t hold the gains. Technically, the close was bullish. However, the only thing I care about are rates. Today Jay Powell tried to talk down rates by saying there was no real inflation. He did a fair job at best with the 10 year close around 1.34%.
I am still not a buyer of tech at current levels. Additionally, many smart beta, multifactor momentum based funds that rebalance quarterly will be sellers of the biggest 12 month winners. Additionally, I would expect some of the biggest recent 6 month gainers like energy will be added to their portfolios.
Feb 22nd
As we have been saying for months now equity risk premiums will adjust if rates move higher. We mentioned 1.50% on the 10 year as cause for concern because the S&P 500 is yielding 1.50%. We also mentioned that high multiple tech names would get hit the hardest. Today the 10 year yield got up to 1.395 causing pressure on the NASDAQ. As long at the 10 year yield continues to climb, I would not touch technology. The NASDAQ (futures) did close at a key support level of 13,220. However, I don’t think buyers will step in until rates test 1.50 and fail. Until there, too many inflationary sectors as we have discussed are working.
Feb 16th
Today we got a nice break out on the 10 year yield that we have been looking for and now the 10 year is stilling at sizable resistance at 1.280%. Yes, I do believe, 1.50% is meaningful as that will be parity with the S&P 500 yield and system traders will adjusted both risk and reposition portfolios. When you hear investors saying that they wouldn’t be concerned with a 10 year until 2.5% to 3% I couldn’t disagree more. Valuations and equity risk premiums are so tightly correlated to rates, especially right here that any little upset will cause a painful pullback.
As we mentioned, the sector that will perform the best is energy and in terms of asset classes, real assets will do well if inflation does truly start to creep back into the economy. I do believe that with the highest savings rate in 40 years and the pent up demand we will see inflation by the summer time. This will be a double edge sward depending on how rates rise.
Feb 12th
The S&P 500 model is getting close to that vital level of 95. One thing I am looking at again is the 10 year yield once again. Once again it is testing 1.20%. I do think a 1.50% yield will cause a reset and put pressure on equities as the S&P 500 is currently yielding 1.54%.
10 year yield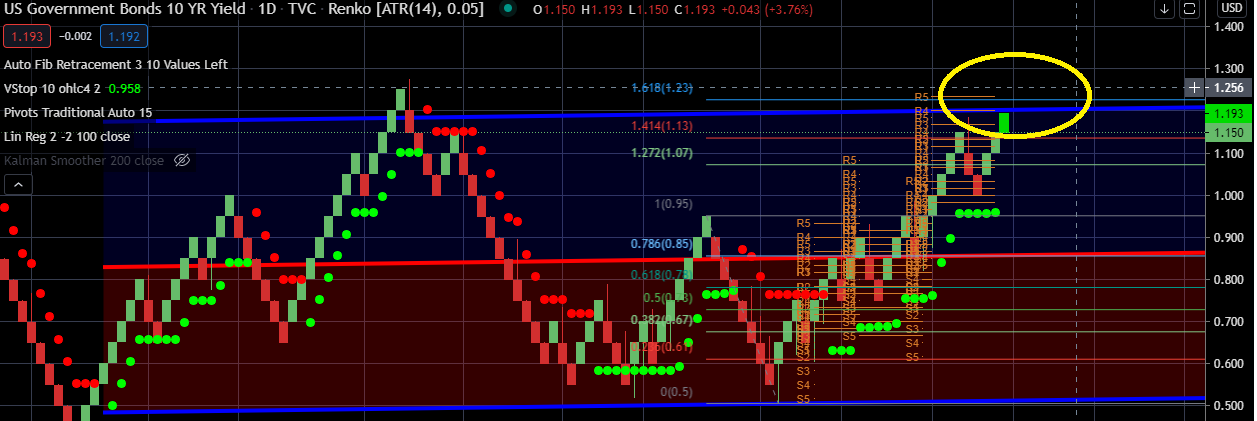
S&P 500 Yield 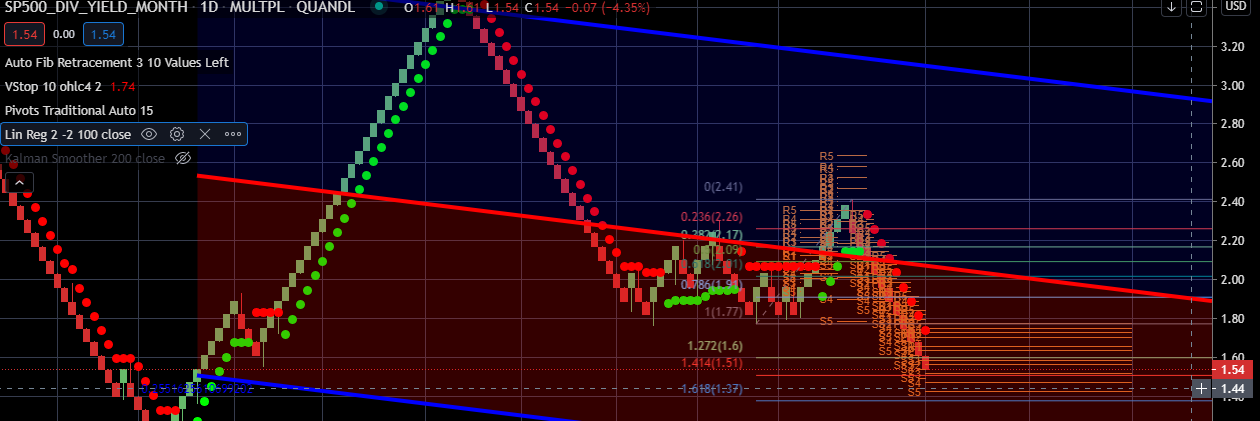
Inflation: every investor is now looking at inflation, will it finally come. I do believe we will ultimately see some and having the right allocation will be more important than what we have seen over the last decade. Commodities have bene the go to asset class to play inflation as has been gold. However, gold has a new competitor for inflationary investments and that is crypto. This could be the cause for golds recent weakness. While Bitcoin is a complete supply and demand trade, I am not a believer in its ability to function as a financial currency because of its volatility. In terms of sectors, historically energy stocks than material stocks perform the best. Utilities and high yield stocks are the worse performing assets.
Feb 6th:
We got a weekly close at all time highs and would expect now one last big push higher that will take the S&P 500 blended model to 95. Remember this is where we want to reduce a significant amount of exposure. I don’t know the level on the S&P 500 but think a 88 to 95 will get us close to 4,000 on the S&P 500. Amazing 4,000 and last march we hit a low of 2,200.
Feb 2nd:
We are now once again attempting to retest the all time highs. As we stated previously, the NASDAQ futures would be bought off 1,2630 most likely. However, Sunday night they only reached 12,730 and bounced hard. Now the NASDAQ is only 90 points from their all time highs of 13,599 (futures). The only concern currently is the current reaction from earning beats, they have not been rewarded. But if we close above the highs on the index’s that won’t matter. As I have been saying, this bubble has a lot more to go before it pops.
Feb 1st:
Back on Jan 27th, we said once the insanity stabilized with this ridiculous REDDIT movement the broad market would find a bid. If you been watching closely, there is an inverse correlation to the decline of the most shorted names and the broad market rallying. We are not going to discuss again why this is as we already discussed this. The bottom-line, GME, BB, BBBY, AMC and the other most shorted names and even the new SLV short squeeze trade need to all crash back to their true intrinsic value for the markets to regain confidence. While this blip could cause a 5% to 10% pullback, this is certainly not what will cause the bubble to pop. And this is a bubble that will pop ultimate from rates. However, most likely this market is going much much higher, beyond levels of our imagination before significant pain is felt.
Jan 30th:
As I mentioned, the market destruction from these shorted names are effecting the market. I do not think this has caused the bubble to pop only rates or the deficit will be the cause.
Monday we either will get an up open that will be sold or a big cap down that will be bought. So I am looking for the NASDAQ to test 12,630 and the S&P 500 3,614. Worse case in my opinion will be NASDAQ 12,220 and S&P 500 3,500. However this is obvious just an opinion and not fact. Nothing fundamental, economical or on the rate side has changed. This is purely liquidation from weak longs. I think this bubble has more to go, but we will see!
Jan 27th:
I think we all agree the market sell off today is caused by a lack of confidence as a result of the most heavily shorted stocks like GME, AMC, BB, BBBY, SPCE. Additionally, pressure is coming from de-grossing hedge exposure from the hedge funds. When you are a hedge fund, they are running their portfolios as dollar or beta neutral. If you cover your shorts you need to sell your long as well to keep the portfolio’s exposure aligned. This causes hedge funds to sell their best winning positions and pressure unforced selling.
Do I think this massive bull run is over, no. Their is too much liquidity and PE multiple and other metrics will remain high. The Fed is backed into a corner and CANNOT back away from their easy policy or the markets will crash and the government will be crushed under their debt service.
I am not looking at levels, all I am looking at is GME, AMC, BB, BBBY SPCE to see these trades slow down in their moves. Once these names slow down maybe even reverse, I think the market will start to stabilize.
I will say, if the S&P 500 closes below 3700 on a Friday close, 3,605 is the next level. As for the NASDAQ if the NASDAQ closes below 12,950, 12,750 is the next level to watch.
Pre Market
We have not post in a while as the mana of the market has made commenting on risk is just a broken record. The Russell is now a -88 counter trend and the most most overbought ever since IWM was created. The market keeps rotating into on factor or sector or index and holds up as there is too much liquidity to take it down.
As for earnings it’s irrelevant that they are beating, they always beat the consensus on average. The real question is where should multiples be and at what point do rates change that. I have no other insight because the Russell is massively overbought and the NASDAQ and S&P 500 are just becoming overbought. I am cautious here!
Jan 5th:
We have a real catalyst today steaming from the Georgia election.
- The 10 year yield is breaking out above 1% because bonds are getting crushed as more spending is likely to increase the deficit.
- I think technology will correct even more as both higher corporate taxes and higher yields will pressure higher multiple stocks. I am avoiding buying the NASDAQ dip. I think if the NASDAQ closes below 12,390, you will see 12,000.
- The Russell is up 2.3% as inflation expectations are increasing from more government spending and higher yields and more government handouts. The Russell hit it all time high this morning.
- The industrials should continue of the back of this DEM win along with green associated energy, and financials on the break out of the 10 year yield. The 10 year yield needs to close above 1.02 for the financials to really get some momentum.
- Be sector specific if you feel compelled to buy.
Jan 4th:
Happy New Year! As we said on Dec 24th its time to take some profits on the Russell, however, its really time to take profits everywhere. The risk reward is not a good set up at these levels. The market is under pressure most likely as the Georgia senate race is underway and the DEMs are gaining ground. The market is certainty worried that if the Dems win spending will increase and their will be little balance of power. Either way, I am not a buyer at these levels.