If you have any questions please feel free to email Brett Golden at Brett@trowbridgellc.com
Hot PPI coupled with Hawkish Fed speak crushed the indexes to close on the lows.

The news was pretty straight forward today.
-
First premarket, futures reversed even before PPI was released as Cleveland Fed President Mester said she saw a compelling case to hike by 50bps.
-
Then, the markets took it on the chin with a hotter than expected PPI coupled with weak housing data and a collapse in Philly Fed = stagflation. Markets picked up the selling to the downside.
-
However, the S&P 500 rebounded 50 handles almost unchanged on the day by 12:00 EST. The 2/10 spread actually bull steepened and yields were barely up on the 10 year yield for such hot data coupled with hawkish Fed speak.
-
Then when everyone thought the market couldn’t go down and was immune to bad data, St. Louis Fed president Jim Bullard said markets need more hikes, there are risks of a replay of 1970 and he wouldn’t rule out supporting a 50bp hike in March.
4,100 is a massive level on the S&P 500 futures and we did close below it. If we get a Friday close below 4,100, it’s easy to see the the S&P test the major inflection point of 4,000. We can see 4,000 being an area that those investors who missed this rally will start start getting long. Why? Because everyone missed this rally and are conditioned to buy dips after rallys that are missed.
S&P 500 Futures

We have previously said since our All Weather models are 40% to 60% underweight their benchmarks in terms of Fixed Income we would increase their exposure if yields start to retest significant levels. Tomorrow we will be adding more bond exposure. If yields revisit their cycle highs (10 Year Yield see below) we will be prepared to add the final allocation if that scenario plays out. Soft, Hard or no landing this trade “not investment” seems logical to us. However, make no mistake, once yields normalize based on our models, our All Weather strategies will go back to their historical allocations of 50% to 70% underweight Fixed Income. Why so little fixed income exposure historically? There are better, less correlated investments than fixed income.


What is going on with this market?
We keep hearing many traders, advisors and strategists seemingly befuddled by the market behavior and that the market should be trading a lot lower. Regardless if we believe in the rally or not, the markets are more efficient than investors comprehend. While we agree this is a very challenging backdrop to understand why the S&P 500 sits at almost 19 times forward earnings as the terminal rate keeps climbing in the last 6 days to 5.30% coupled with earnings that continue to contract. However, let’s take a look at a few bull and bear case points and how we got here.
As we said in December, the markets do not care that earning estimates are declining as long as the market forecasts rate cuts and earnings trough.
First we will discuss the fundamental rationale for the market’s rise. Let us stress, we believe the rally like all rallys are initially mechanical caused by quantitative price action. However, let’s just explore the most simple explanation of the fundamentals.
1. For the last quarter the markets have projected 200bps of cuts by 2025, which were pushed forward to mid 2024 after Powell’s last dovish Presser. However, in the last several days the market is now only pricing in 100 bps and the most sensitive stock have not cared and rallied (long duration technology). The chart below was the Fed fund protected rate cuts coming into the end of 2022.

2. Markets are efficient at forecasting earnings peaks and troughs.
- The first chart from Bernstein is why most fundamental strategist are scratching their heads. The S&P index is climbing as EPS for the index is declining for a couple quarters.
- However, the market is pricing in a trough in earnings as revisions in the US and Europe are increasing as seen in the second chart provided by Morgan Stanley.
- The third chart is why so many investors after a tough 2022 want to get ahead of a recovery in higher beta technology. Why investors are jumping in now for the future recovery. As we can see from the third chart earnings finish going down 6 to 9 months before the index already has recovered.
- The fourth and final fundamental chart is showing that forward declines in EPS in an economic decline take a lot longer to happen than investors anticipate.


Now we will discuss our core competency and what we really believe is happening. Trying to trade asset classes and indexes by forecasting if we have a hard, soft or no recession is absolute insanity. This is why we are Trend Followers, while trend following wont work 100% of the time in the entire market cycle, it reduces the emotional guess work, reduces risk and generates returns to meet liabilities. Additionally, this is why we lean heavily on absolute return strategies.
Here is a list by importance why we are rallying.
- Momentum reversion: Every January you get a rebalance in the momentum factor. If you watched the video on momentum you will know there is well over a $1 trillion dollars in assets of investment funds that incorporate momentum as a factor. Every stat arb, CTA, Quant Smart beta and even plan vanilla long only managers reference momentum in their process. This December/January had the largest momentum reversion occurring to Goldman sachs. Simply put, the fund sells 6/12 month blended largest returns gainers and buys the lowest scoring 6/12 month losers. This was most prevalent this year as you had a massive variance between inflationary and defensive sectors and stocks like XLE vs. XLK. This started the initial buying in tech which then started to result in short covering.
- Everyone came into 2023 underweight risk: Off -sides, either short or in cash. Mutual funds had the lowest level beta exposure since 2019 as we discussed in several posts back.
- Hedge fund negative on tech: HF were significantly short with their lowest long exposure in 4 or 5 years (refer to previous post for data).
- Every Sell Side strategist: like Goldman, UBS, Morgan were all calling back in Dec for 3,600 in the first half of 2023.
- January fund flows: are the biggest in 1 month of January than the preceding 11, soaking up all the supply. (refer to previous post for data).
- Momentum: Many technology stocks that had either negative absolute or relative momentum now are starting to become positive. (Refer to our momentum video on the difference between absolute and relative momentum). This means stocks that had negative momentum in tech for the last 12 months could not be bought by system traders, however are now allowed to buy them.
- Trend followers in equities “Quants” get long as trends go positive and keep building on price strength on their models regardless of the fundamentals. The third chart below is an example of NVDA, the outlook fundamentally has not significantly changed, but the trend certainly continues to improve where quants continue to add until it becomes fully exhausted.
- FOMO and managers need to keep pace with the index as quants are not asking why XYZ has a high PE, they just keep buying as price improves. (See third NVDA chart below)
- Central Bank Liquidity baby! Lastly, the markets are seeing $1 trillion in balance sheet liquidity infused by PBOC China Central Bank, and balance sheets around the world collectively for the first time in maybe a year are not declining. This certainly helps create a backdrop for risk assets. This is supporting the speculative rise in equities everywhere. Lastly, which is very important that no one talks about is the FED’s Reverse Repo Facility has been increasing and you better believe the larger this RRP grows so do multiples on stocks.
One last thing, we have discussed this before and it’s not the cause of the rally but it is why we are seeing irrational moves in mega cap stocks that would otherwise never happen. Nomura’s Charlie McElligott has been discussing this of late what is known as ODTE Option phenomenon, growing more powerful and prevalent by the day. These are Zero Day expiration options. Like black rolete if you will!
McElligott says on average over the past month, nearly 1 out of every 2 Options traded on SPX, SPY and QQQ are 0 days until expiration. Wow this is crazy. He presents the chart below and you can see how much volume these ODTE options have exploded (in red).
We have shown this chart before by Goldman, but we just hit another new high volume season Tuesday with SPX 0DTE. 50% of all options traded expired 6.5 hours or less on SPX.


January 13th
Another Massive CPI Print Tomorrow and it is expected to be slightly hotter

As we can see from the chart provided by Deutsche Banks Jim Reid above, we can see inflation is still falling, however at a slower pace and the new revisions are now higher than the previous inflation expectations. Jim points out that the annualized core rate is tracking 4.25% vs the previous 3.14% from the previous months data.
The market is already pricing this in as rates have already moved .35bps off their lows on the 10 Year Yield after a week ago stronger labor report and BLS’s revised calculation. If you weren’t closely watching, last week the BLS published its annual revisions to CPI and the market viewed this bearish for equities as they changed their weights.
Jim’s colleague Justin Weidner points out used car prices are increasing once again measured by the Manheim Used Vehicle Index.


Lastly, while I think making market calls based on valuations is a terrible strategy, let’s just be aware how expensive the market currently is. There has been only 2 other periods since 1980 where the S&P 500 has been more expensive. I am hearing a lot of advisors telling us that client’s are asking them to put more risk on as they see the market moving higher. This FOMO is exactly the opposite strategy that should be taken at this juncture.
In the short term yes the markets machinacilly are under weight risk and seemly want to move higher. However, the equity markets are exceptionally complacent and if we get a headline print tomorrow of equal or greater to 6.50% markets will want to push higher. However, once everyone is sucked back into the markets the narrative will focus back on the economic and fundamental data and revert lower. If clients are asking to get more risk on, be patient, let the markets come to you to get more aggressive and don’t chase this market. You will get an opportunity at much better levels to deploy capital. In fact, any move above 4,200 to 4,300 would be a welcome opportunity to de-risk.
Feb 8th the close
S&P 500 & NASDAQ levels are still in play. China trade is in play and my thoughts on the Yield Curve Potential breakdown.
-
S&P / NASDAQ Strength: When the trend strength and breath get to the current readings we are seeing on our models, a sudden reversion is not imminent. It will be more of a slower grind of losing support as long systems will keep buying until short term levels break. Additionally, many long onlys missed January’s move and will be compelled to buy these pullbacks.
-
That 4,127 level we discussed on Friday remains a stubborn level to take out on a downside close, but give it another day as 4,067 (updated 4,059) we mentioned on Friday is growing more likely. 4,130 (today’s close).

-
Yield Curve: While we know the lag effect is 10 to 12 months on inversion of the curve to recession and at best its a blunt single. However, keep an eye on the lows of -.845% for a potential break lower. Today you inverted another -2.4% and while this is an irrelevant %. I can see where credit spreads start to expand if we take out the lows of this cycle and move to the next support area of -.942%. I would assume the narrative will shift to one of concern, where markets will focus on the credit markets and the potential for slower lending to the most risky parts of the cap structure. I would expect the massive support level of 3,988 to be tested if the yield curve does invest to -.942%. (see yield curve chart below)

-
China Update: Last Friday we wanted to alert anyone trading in Chinese names beware of the reversal. We stated, “FXI rejected an upper level and had a medium term break at $31.25 and if this doesn’t hold $30.60, $28.50 is in play”.
-
This trade has triggered and in effect. If you are trading pairs send me your names and I can provide some color on the potential variance. Todays close $30.46.
Now is the time to be very cautious based on the underlying market behavior, this is not a healthy market that we are seeing. If you feel better about the markets and that the worst is over, well we have some data points to share with you. Do not get caught up in FOMO, humans are emotional and this leads to poor investment decisions. If you don’t think these following data points are not concerning, then please call me directly to discuss them (Brett -917-653-3153).
Here are all the concerning key points not in order of relevance.
- S&P 500 P/E: While the P/E ratio and looking strictly looking at multiples are terrible gauges alone for investment decisions, the S&P 500 is trading at a historically high 18 time forward earnings where S&P 500 companies margins are declining. That is concerning. If earnings have trough and the Fed stops reducing the balance sheet and cuts 50bps in q4 we can make an argument for a very high PE of 20. However, earnings have not yet troughed and the balance sheet is still being reduced.
- Profit Margins: Margins are still being compressed, meaning earnings have not troughed. (see 1st chart below)
- Earning revisions are declining significantly in Q4 still no trough, although technology revisions have moved higher. The only bright spot. (see 2nd chart).
- Leverage: There is still way too much leverage in the system, look at the Wilshire to GDP. This is the best gauge of leverage. (see 3rd chart below)
- Balance Sheet: Two years ago The Fed’s balance (see 4th chart below) sheet this was our largest concern, which now is on the back burner because they will need to stop by the end of 2023 or early 2024 if the Fed Fund Futures are currently correct that the Fed will be cutting rates by 200bps (see chart 5 below). However, we still believe this is a headwind for stocks at the current moment. The relationship or correlation of Central Banks balance sheets to stocks we have shown 100 times. The Global Central Banks Balance sheets were the reason for technology & the growth trade to experience its multiple expansion and price increases, it wasn’t earning’s expansion (see chart 6 below).
- Funds are weaponizing Gamma: Funds are trading more short dated options than ever before. As prices move higher more quickly dealers need to take the other side to maintain an orderly properly functioning market, this however exacerbates moves in either direction. We believe this is causing gamma squeezes larger than ever before when they trigger, where you see large cap stocks up or even down 15% to 30% in 1 day (even Soft Bank was doing this during COVID with a $5 billion gamma strategy). While, I don’t have data to show the gamma squeeze data (see chart 7 below), the following chart shows the highest one day short term options volume in history last week. That is not investing or hedging a portfolio.
- Short Squeeze: Last Thursday was the largest short squeeze in 8 years, ranked in the 99 percentile, because Powell led the markets to believe 50bps of cuts are now in the cards and maybe they are based on the lag effect of how bad ISM’s are crashing. But you would never know it by a 3.4 unemployment rate that just ticked lower on Friday (see our Friday note below for this). Now we have been saying for 2 months earnings don’t matter and the market was already pricing in 200bps of rate cuts by 2025 and should provide a backstop or a market put. But you can’t have the market trade at 4,500 on the S&P 500 or 20 times earnings when you are still getting margins for the index compressing lower coupled with ISMs still in free fail. While we understand CPI and inflation is significantly declining and on pace for 3% by year-end. At what cost does this leave the economy even if the Fed does cut 200bps by late 2024. For 2023 the upside at this currently level is very limited and risks are set up for the downside. (see chart 8 below)
- Inflection point for technology: Since late Nov we have been calling for the upper range potential of 12,800 on the NASDAQ futures which we briefly took out this week. If you have been watching this call, we said 12,800 was an excellent level to de-risk growth because this was its volatility stop. The last 2 failures at the NASDAQ Volatility stops were around 15,300 and 13,600 (see chart 9) and as you will recall you said take down technology and growth risk there. We believe this is a similar set up. However, a weekly close is very possible and will take the index to 13,650, where taking down more growth exposure would be even more warranted.
- Positive Global Growth: The one positive aspect but not for the U.S. is Global growth has bottomed and earning revisions are increasing. This could provide some support for U.S. earnings (see 10th Chart below)
- Money Market Cash Level: Another more mechanical market structure positive is the massive amount of Money Market Cash that Goldman Sach points out (see chart 11 below). Now keep in mind there is more fiscal and monetary liquidity than 2008, but there is currently $900 billion in Money markets than 2008. Never has there been this much in Monday Markets, $4,850 trillion, slightly more than 2020. Another reason equity markets have such a strong underneath bid when markets rally. If this cash flows to the markets, the ultimate level on the S&P 500 futures, we would take down some risk would be 4,300. (see 12th chart). Dynamic Alpha will not take down exposure, only the All Weather Models will. Dynamic Alpha operates on an individual stock basis not the index level. However, Dynamic Alpha is not allowed to buy any new stocks if our S&P 500 model is at 90, its currently a 57, a long ways away. (see chart 13 below of S&P 500 model)
Summary: For those of you wanting to sell value and move back into growth, give it a little more time, you will have another opportunity at much better prices. Our job is not to make long term market forecasts, there are no good long term forecasters. As quants we never get too bullish or bearish, but what we are conveying here is be objective with these current facts. Just because the markets have rallied, you have an amazing opportunity to de-risk and review Trowbridges All Weather Strategies that seek a similar market cycle return to a 60/40 or 80/20 with 40% to 50% less drawdowns now is the time. You can explore more here on these strategies. Or if you build your own models review Dynamic Alpha that is a Large Cap U.S. equity concentrated portfolio that from inception of March 2015 to Dec 30th 2022 has generated a greater return than the S&P 500 with 3.50% less annualized volatility, outperformed all major drawdowns and 83% of the time outperformed the S&P 500 18 worst monthly performance. See Dynamic Alpha here
Or set up a time to speak with me to review your current allocation vs our All Weather Strategies.


Friday Feb 3rd
What an intense week and we hope everyone can get some rest this weekend!
We have a few clients asking why not move into technology as this move occured. The answer is we are systematic and unemotional and that is the benefit long term of our process. Our system will not buy into short covering rallys, over 30 years of testing individual equities response to short squeezes causes too much portfolio volatility. If we were trading the stocks on a 14 to 30 day time period yes, there is absolutely alpha to be generated from short squeezes. To reiterate, Dynamic Alpha long term wants to outperform the S&P 500 but with less volatility. In all of our research and testing, this current period we are witnessing is not sustainable and does’t not warrant a mass rotation into the most shorted stocks high beta that are up 40% in three weeks. That is not investing, it’s trading.
The past few weeks have been nothing more than a massive short covering rally.
-
- Goldman said yesterday’s short covering was the largest in 8 years and was in the 99.9th percentile vs. the past 10 years.” (See 2nd Chart below)
- Goldman said yesterday was the highest option volume ever in history. This is important as it is causing gamma squeezes. (See 3rd chart below).
- Options have been gaming the stocks within the market unlike anything we have ever seen before as funds manipulate the gamma squeeze. This was seen in 2020 with Discovery Communications and many other stocks by hedge fund manager Bill Hwang. If you haven’t read the story, click here.
- For weeks we have told everyone reduce growth exposure if the NASDAQ hit 12,800 as it was a massively important level that we did not believe would be taken out on a closing basis. Today we closed at 12,600. Eventually, we will break out, but again, under the current economic conditions and earnings compressing within tech, it’s not probable.
- Rates: As I discussed yesterday, I thought it was a weak showing both on the dollar and the 10-year yield neither had broken down. Then today, the jobs number significantly flipped the momentum trade upside down where inflationary benefactors and defensive names along with financials caught a bid.
- 10 year yield, this part of the carve is what I watch mostly, and 3.556% is the next level of resistance. If we get a close above this level we could get a full measured move counter trend rally back to 3.723% which is something to watch for those trading longer duration cash flow names.
- USD: via the DXY. Equally important as the 10 year, keep an eye on $103.50 as a small counter trend rally is developing as $102 could not break lower.
- NASDAQ: To reiterate the step function of a potential decline on the nasdaq. A closed below 12,580 is as follows
- 12,300 in play Monday and a close below here the big test of (updated) 11,930.
- S&P 500: 4,127 break we roll to 4,067. The make or break level is now 3,984
- China: FXI rejected an upper level and had a medium term break at $31.25 and if this doesn’t hold $30.60, $28.50 is in play. This is seen in the first chart. As you know we do not like China as an asset class in our All Weather portfolios because of the lack of alpha low sharpe ratio and volatility.

Feb 1st
Powell completely caved today and was rather weak, shifting the narrative for the markets to believe the end is near rather than higher for longer. Sending the Terminal rate projections down 50bps with his disinflationary rhetoric He started off with two hawkish statements that more work needed to be done and requiring a restrictive policy. Then markets went parabolic when Powell completely brushed off when asked about the easing of financial conditions, which was the main cause for the hawkish consensus view that everyone and their mother has been referencing including myself. I doubt the market does any serious back and fill at this juncture as the terminal rate projection fell by .50bps and doubt this flips tomorrow.
- S&P 500 Futures: Yesterday we stated, “A close above the 4,118 level would take the index to 4,170. Today’s high was 4,163.25 and even though we did not hold or close above 4,170 I expect a retest of this level at min. At which point I will have to defer to the readings on my model to determine if the ultimate reading of 70 is a high probability. Remember, per my email yesterday a 70 reading gets us close to 4,300. So in the interim, dips will be bought for a test of 4,170.
- NASDAQ Futures: Yesterday I stated, “have medium conviction to reduce longs at 12,480”. Today’s high was 12,525 and settled around 12,400, however with META’s reporting after hours today, NASDAQ futures are sitting above 12,500. It seems logical that the ultimate level we discussed of 12,800 is probable. The first attempt to break above 12,800 will be exceptionally difficult as discussed for the last several weeks and I believe the first attempt is a high conviction set up to sell. However, a close at this pivotal level, especially on a Friday, the NASDAQ can have an extremely powerful move to the upside. If this does trigger, I would get long calls on the index, because it’s a strong probability we will see 13,650. This will be confirmed with a complete break down in the dollar and the 10 year that we have discussed many times.
- Apple: Since Apple is reporting tomorrow, its worth discussing as it will impact our 12,800 level. Unlike MSFT, META, AMZN or GOOG, Apple is still heavily shorted and over sold on a relative basis based on our counter trend model. Our counter trend model as seen below is a +19, while not in the 99 percentile of oversold, its enough to propel the stock up to the big resistance level of $154 providing some bullish carry to 12,800. Which would still be a sell. (see first chart below – green bars)
- My models on the indexes have not updated yet, so I don’t have visibility into the readings after the close just yet.
- U.S. Dollar: I have been discussing the Dollar via the DXY ETF and the $100 level as a tailwind for growth since we took out $109. Keep an eye on this level. You take out $100 on the downside on a close, tech is going to get a bid. See below (second chart).
- 10 Year Yield: I have been discussing for the last month, a weekly close below the 3.38% on the 10 year as a powerful tail wind. I would expect we will need some weaker BLS data to break this level on a close. (third Chart)


10 Year Yield

- Per my long trade setup mentioned yesterday, the medium term back up the truck long trades remain S&P 500 3,880 and NASDAQ 11,450. For those who want to add to long exposure on any initial decline caused by Powell’s presser, you may get a bounce off of S&P 500 3,943, however this is nothing more than a day trade.
- S&P 500 Futures: A close above 4,118 add long exposure for that 4,170 level that we discussed on January 12th below.
- NASDAQ Futures: No longer a seller at 12,390. Strictly based on my NASDAQ model’s last similar move in August, I have a medium conviction to reduce longs or short at 12,480. Remember, the high conviction short trade I discussed back on January 12th would be the 12,800 region. A close above 12,480 will get you to that 12,800. This would be the same vol stop failure the index saw in March 2022 and August 2022.
- Our S&P model is currently reading a 31, click the first chart below to enlarge.
- This reading is lower than both previous failed break out attempts of:
- 35 reading Dec 13th 2022
- 43 reading Aug 23rd 2022
- If the model takes out the 43 reading on the upside the model will pick up significant strength from my calculation to reach roughly a 70 before failure.
- This percentage move correlates inline with 4,300 on the S&P 500 above my 4170 upper level target.
- Currently, I see this as a low probability from everything I see. If we retest 43 from the summer that puts us at almost 4,170, as I mentioned a week ago and would be a seller.
- My proprotary Strong Buy to Strong Sell ratio of S&P 500 stocks is sitting around 288 strong buys. This is a very solid way of looking at breadth. From my testing if the S&P 500 does not move above 330 strong buys this is where historically the S&P 500 starts to stall.
- Summary: If the S&P 500 model can not significantly break above the 43 reading, regardless of the current level, I will have much conviction to take down long exposure and short the index.

Strong Buys to Strong Sells

Saturday, January 28th
S&P 500 Failure: What now? Friday’s 4,100 failure on the S&P futures was not as concerning as many strategists would lead you to believe. Yes, we were sellers on the first attempt of this breakout which failed, but we were not bearish just yet.
Here is how I view the current set up and how to play this coming Wednesday’s Fed meeting:
- The first attempt of a significant break that has massive supply overhang is alway a difficult challenge. So I would not read too much into this failure. Failure needs to take time to exhaust its exuberance with another attempt!
- I would expect a little back and fill pre-market based on Fridays close on Monday which will be bought. The next small level of support on the S&P is 4,040. The rationale for dip buying is as follows:
- Mutual fund beta exposure is at the lowest level since 2019.
- L/S exposure is almost at the lowest long exposure since January 2021, excluding summer 2022.
- Our S&P 500 & NASDAQ rating value (composite trend model) strength continually builds on strength and typically does not reverse course on trend just yet.
- Bottomline is that many long only investors still need to play catch up and will buy the dip as low vol, defensive high momentum stocks are negative for the month of January, providing additional support to chase growth/NASDAQ. Our rating value for the NASDAQ just went positive .20 almost an identical move as we saw over August and if this plays out in similar fashion we have another 4% on the upside.

The Set Up:
The big wild card for the S&P and NASDAQ will be Powell’s presser Wednesday. Financial conditions based on the bloomberg index (see below) are at the lowest or most easy financial conditions since March of 2022. This gives Powell all the opportunity to talk down the markets and be hawkish. Preferably, I would like to see growth / Tech move higher into Wednesday’s Powell’s presser as the risk is to the downside. I will be less bearish on any decline on the NASDAQ heading into Wednesday, which does not seem likely at this juncture. Ideally, 12,390 pre Wednesday would be an opportunity to lean into the growth factor on the short side as Powell has every opportunity to deliver a hawkish stance. While ISM and leading inflationary indicators have declined since his last presser, Powell most focused indicator of wage and labor data has not declined to any meaningful degree. If Powell’s message sets up dovish the next stop is 12,800 on the NASDAQ and 4,170 on the S&P 500.
A more hawkish Powell: Downside target for the NASDAQ is 11,750 & 3,960 for the S&P 500.

Friday, January 27th
Quick follow up from our S&P 500 call yesterday Jan 28th: “For anyone looking for a short term trade, I would be a seller of the S&P 500 at 4100 and take it off if we get a Friday close above this level.
- We have 2 hours left, to irretrate, take off this short trade if we close above 4,100. The close is key and a close above here is going to be very powerful. There is a lot of supply at 4100 so it won’t be easy to take this out on a closing basis.
NASDAQ: no change in our view, the next stop seems probable we discussed yesterday of 12,390.
Wed Jan 25th
What an exciting day. The equity markets had every opportunity to fail today and rejected that notion. Our S&P 500 target of 4,130 seems likely at this juncture unless AAPL, GOOG, AMZN and even NVDA completely blow up earnings. To see our NASDQ (futures) level please visit our January 13th note below)
As we mentioned several times (see January 11th note) the market currently under the narrative that rate cuts are coming in Q4 doesn’t care about earnings contraction. Case in point was MSFT today, the street knew earnings, margins and rev growth would come in light, this was never in question. The enterprise business saw some of the greatest secular growth of any group within technology as a result of COVID. What caused concern early premarket was MSFT guided lower, which was in our opinion to set expectations for a Q1 beat. Every trader knew this as MSFT was providing some room for themselves and the decline was bought.
Another important reason for the rally today was investor positioning.
- Long only Investors are underweight equities. Long only investors are under allocated and after a massive start to the year this gave them the opportunity to add some exposure. The second pullback won’t be so easy of a buy the dip. If you doubt this rational for the rally, just look a the recent survey conducted by JP Morgan of investment managers.

- Then there are hedge fund who are heavy short technology. On January 24th, Goldman Sachs prime brokerage desk saw the largest 1-day notional short covering since June 22 which they said was in the 99th percentile in 5 years.)

- Below 2 great charts from Barclays on investor positioning. The first chart shows mutual fund equity beta is really low! The second chart shows that Macro hedge funds are not short equities anymore and actually increasing their long exposure as seen in the second chart.


Friday, January 20th
Don’t get too excited about today’s move higher in markets. Today’s price action in the CASINO “AKA” the Market was just another typical massive option’s expiration move trying to pin the index’s to the nearest strike. We have witnessed this exact behavior for the last few years, but the volumes are growing which causes gamma squeezes. The amount of short dated options being traded has exploded in volume causing the indexes to get pinned into large levels. Even though the S&P 500 futures closed up 70 handles, it was just shy of its pin at 4,000 with a close at 3,989.
For those who question the option expiration theory today as being the cause for today’s move, look at this chart from Goldman. 50% of options traded on SPX expire today, WOW. Unfortunately, this has completely turned the markets into a Casino. Brilliantly, market pundits on TV were out in full force today, scratching their heads throwing reasons in the wind why the markets were up 1.50% to 2.50%. The reason was mechanical unfortunately and nothing has changed yet! The S&P 500 is getting tighter and tighter and is about to make a binary large move.

Source: Goldman Sachs

Stagflation? As we all know global inflation is dropping like a rock which is welcomed. Although it will put pressure on profit margins in many industry groups for a while who benefited from their rising revenue last year. Here is a chart from Credit Agricole on the global inflation front.


All Weather Models
For the last 2 months we have been discussing increasing our allocation to fixed income for a medium term trade. Below we have highlighted our rating value and counter trend models for AGG, which drove our process to increase exposure to Treasuries. Medium term for those curious would be the 10 year Yield trading into 2.80% region, a massive level. As you know our models have been underweight fixed income relative to their benchmarks by 50% to 70% depending on the strategy. If and when yields hit our target, we will look to take down our allocation back to the model’s historical weight. We believe fixed income will be a drag on performance once inflation has normalized.
Today, we added 2% across the board as the 10 year yield closed up 2.68% and we look to add on any sell off within Treasuries as our models increase in strength.

Wed, January 18th
Two things for today’s sell off we wanted to point out.
1. The market rejected the move on the 200 day moving average over several days. We are not a fan of using moving averages and have found in our research the 200 day moving average has a 50/50% probability of dictating future price performance well. However, it gave some reason to traders to short the market and sell on the PPI and retail number this morning which leads us to the important issue.
2. On January 9th we discussed one of Mike Wilsons (Morgan Stanley) concerns: “He believes earnings collapsing supersedes inflation normalizing as companies operating leverage will decline and hurt companies margins (earnings) as costs fall faster than end prices”. Well today in the PPI the cost for goods sold declined or plunged the most since COVID lockdowns (see below from Bloomberg). This is why we are seeing massive selling in consumer goods today like canned goods and food companies like HSY, GIS and CPB. This is why low vol ETFs like SPLV are significantly underperforming the S&P 500 by .90% alone today.
We own GIS and CPB as well, which had a high score on our models until the last 4 or 5 days, however it was too early to sell as the socring was not low enough. So we will have to wait to see where these stabilize in price. However, for those of you using low volatility ETF, be very cautious here as many consumer defensive names are slightly expensive after the 2022 run and now the market is growing concerned with negative operating margins within this group. This is pure mean reversion from the 2022 winning trade.

Lastly, we have discussed several times that the 10 year yield has massive support at 3.40% and a close below this level will cause more buying within the 10 Year Treasury.
Friday, January 13th
S&P 500 Futures
- Friday, January 6th: We discussed 4,015 as being a large level of resistance that warrants some reduction of risk. A close above this level will take the index back to 4,100.
- Wed, January 11th: We said 4,015 was the level to look for after the CPI print and it was immaterial that 4,015 failed to hold and still think 4,080 and 4,130 are areas to reduce long exposure (increase shorts or hedges). One exception is if the 10 year yield as previously discussed closes below 3.40%. This might change the market dynamics.
- Failed Rejection: Today the indexes had every opportunity to fail as weak longs never sold the recent front running of a cooler CPI. Additionally, the Money Center banks solid reversal from premarket lows will support the bullish narrative in the short term.
- Medium Duration CTA’s: Looking at our own S&P 500 model (see first graph below) which is medium frequency (60 to 120 days) just moved from a -.07 to a +.11. For your reference, .11 is a very weak long or neutral reading and .65 is where markets start to squeeze. The key point is that it went positive. The CTA duration is important because the longer the duration, the more money is allocated to the trade. That is why shorter quant systems have capacity constraints.
- Conclusion:
- Many negative momentum stocks within the S&P are about to go positive, which will provide some upside fire power on the index and draw in short term system buyers before we can see a meaningful reversion lower. In my opinion, this is a typical pattern of January and less of a real regime change in longer term momentum. So weak longs will be sucked into the market.
- Before this current cycle is complete, the target levels I am looking at are 4,130 to max 4,170 with a reversion back to 3,874. I am basing this move on our S&P 500 composite forecast model (as seen in the second chart below). It’s sitting at a .05 and I am looking for a +30 before falling back to 0 once again.
S&P 500 Compositive Model (click to enlarge)
NASDAQ Futures
The NASDAQ currently has a -.74 reading vs the S&P 500’s +.11 on our model, which certainly provides the NASDAQ a lot more outperformance over the S&P 500 on any weaker economic or job’s number data via lower yields.
- Based on the current very weakened state of our NASDAQ models reading, it wont take much to get to the 12,000 level where I would be a seller.
- As mentioned yesterday, a close below 3.40% on the 10 Year Yield is all air until 3%. This could be a large enough catalyst, in my opinion, to get the NASDAQ to the ultimate level of 12,800, at which point I would be a strong seller at the first retest. I think the 12,800 level is extremally premature.
Jan Friday 13th
CPI came in exactly as expected and our target on the S&P 500 4,015 was hit. The most negative momentum names within technology like semis lead the market and safety stocks with the great momentum lagged. Today was textbook! If we had to guess it will take a higher level on the S&P 500 like the 4,130 we discussed for the narrative to change that the economy is weakening and corporate margins are compressing. We believe the easy money in these deeply oversold technology stocks have largely been played out unless we get that massive move lower on the 10 year yield discussed below.
1. The 10 year yield is approaching a massive level. I spoke with a few of you about that 3.42% level. I think it will be very difficult to close below this level without a large catalyst like another weaker ISM services or a miss on BLS jobs. However, a weekly close below 3.40% is going to cause a large rally in bonds that will cause a lot of positive vol as it is all air until 3%. This will have a very positive effect on longer duration growth names.

2. We have been discussing $103 for the last month as the next large area of support for the DXY / U.S.D. Well the line in the sand for DXY is now approaching critical support at $102.30 which I think will take a great deal to crack. A close below here you are sitting at $100.

3. Lastly, for those who received our piece on the S&P 500 levels yesterday for CPI’s setup. A close below 4,015 will have a non-material impact in my opinion. Until January’s rotation into negative momentum stocks is complete, I still believe the large level to derisk longs as mentioned yesterday ill be the 4,080 & 4,130 region respectively.
Jan Thursday 2nd
Is Inflation about to crash and corporate margins compress?
The great thing about having a systematic investment approach is you never get too bullish or bearish. If you have recently read Morgan Stanley’s Chief Strategist Mike Wilson’s note, you are now liquidating your portfolio and going to 100% cash. While he makes a lot of very valid arguments for his bearish view and we agree the market is expensive and corporate margins will compress further based on the fundamental backdrop. However, we do disagree about one vital thing, markets care more about QT/QE (quantitative Tightening/ Quantitative Easing) over earnings.
In Wilson’s latest very bearish note he believes (CPI) inflation is crashing much faster than the Fed realizes and by the time the Fed can do anything about saving the economy, it will be too late as earnings will already be collapsing. The first chart below is why Wilson believes CPI is about to fall off a cliff and why the markets rallied so hard on last Friday’s weaker ISM. The chart clearly shows that ISM always leads CPI, which has fallen off a cliff. He also shows in the second chart below that never in history has the Fed raised rates while both ISM Manufacturing and Services declined. He does realize that falling inflation is a positive, although he believes this takes a back seat to margins compressing. He believes earnings collapsing supersedes inflation normalizing as companies operating leverage will decline and hurt companies margins (earnings) as costs fall faster than end prices. Which makes complete logical sense, unfortunately, for well over a decade, the market traded more on liquidity and no true price discovery from the addiction of the Fed’s $9 trillion balance sheet bubble.
Wilson believes the S&P 500 earnings are vastly overstated and writes the market has 20% lower regardless how much inflation declines. In his note he suggests that the S&P 500 will ultimately earn around $190 base case and $180 bear case vs consensus $225. Wilson writes that the equity risk premium will need to rise, which will cause the S&P 500 P/E to fall to 13 times forward earnings. This is where we disagree. The first sign of a pivot from a decelerating trending CPI, multiples will expand regardless how bad earnings start to compress. The market will get more expensive. The markets are upwardly biased and addicted to easy monetary policy more than quality earnings. This is why the S&P is not currently trading more at equilibrium of 15 times and why the stocks multiple expanded 3X over the last few years. The market only cares about easy money.
While we agree the E or P/E will decline in 2023, however the market is upwardly biased and will focus on inflation first, not earnings. This will result in the need to be a stock selector and not buying at the index level. The bottom-line trying to forecast longer term future direction of markets is not a game you can win. Over the last several months there has been no clear regime change for a long term bullish trend in sectors or industry groups. Dynamic Alpha has played it close to the vest with more defensive areas of the market and some trades that did not transpire into strong gains. While this may remain the case in the near future, our mission once our model identifies the best risk to reward opportunity is to invest in these stocks. If these investments present risk or the broad market has systematic risk then the models look to reduce risk and wait for the next opportunity.
In conclusion, based on the recent ISM data, Thursday’s CPI looks to come in cool and 4,015 on the S&P 500 futures is the next stop then 4080. For those who are concerned with risk 4,130 is an area that might warrant de-risking.


Friday, January 6th
Round 1 goes to the soft landing scenario as wage inflation and ISM declines!
On Tuesday January 3rd we stated,
- We said the good news was everyone was bearish. “The Consensus Street View is full on Bear, (remember consensus never generates alpha) the good news is almost all of the Wall Street Strategists coming into 2022 were wrong (exception Mike Wilson & Michael Harnett)”.
- Additionally, we also said the only thing to drive 2023 market returns will be the labor market. “In our opinion the unknown, “most important variable” will be the labor market. This will drive the soft landing and the Fed pivot”.
Wage Inflation: Today’s highs of 2.50% or 97 points on the S&P 500 was a little over zealous. This was clearly more from every investor being off sides on their long positioning and hedged. As we can see below Average hourly earnings was revised lower from 4.8% to 4.6%, the lowest since Aug 202, sparking hopes of a more accommodative Fed.


Today we saw a 2.21% gain for the S&P 500 as the jobs number came in stronger, however, wage inflation pressure showed signs of easing. The Treasury market took this seriously as the 2 year-yield declined 4.35% and the 10 year-yield declined 4.11%. As you know we have been bullish on bonds for the first half of the year, regardless of a recession or a market recovery. The next massive level to watch on the 10 year yield as a game changer will be a close below 3.42%.


All Weather Portfolio’sUnfortunately, we did not get the chance to add the last half of our fixed income exposure as we were waiting for 4% on the 10 year treasury. The good news is we added the first half at higher levels and are allocated to other asset classes that are working.
Dynamic Alpha
We feel very comfortable with the current positioning of Dynamic Alpha. The portfolio is roughly 21% cash and still is defensive, yet the portfolio is just about inline with the S&P 500 for January. The portfolio added XOM on Wednesday and reduced AZO as a recessionary play. We expect to see more rotation happening in the next few weeks.
S&P 500 Levels
For those investors who want to be tactical, 4,015 is a large level of resistance on the S&P 500 futures that would warrant some reduction to risk. A close above this level will take the index back to 4,100 and a 18.2 times forward earnings multiple.
Nov 17th
Today was concerning as the response within the market felt that the narrative is changing to recessionary fears. As we pointed out yesterday, we felt this narrative change would happen in Q1 2023, we stated: “We could see the narrative go from celebrating the decline of CPI/PCE/PPI and recovery to the realization that markets have yet to see the full impact of rising rates. Thus, this will result in even lower economic output and earnings revised even lower.”
So why today do we feel that the narrative started to change toward the fear of increased recessionary concerns? It was todays simple breakout of the 2/10 yield spread, a further bear steepening of the yield curve. Yes, the yield curve has been inverted for 7 months. However, this is not what is relevant. What is relevant is that over the last several months the 2/10 yield curve has been inverted between .30bps to .55bps. Finally today the curve inverted .67, a level that has never been seen, at least as far back as our data from 1989 suggests.

Does this mean there is a chance of an eminent correction, that is not what we are saying. These are longer term signals that are not extremally timely. However, it is concerning if you care about managing risk. We felt that ultimately the narrative would change from celebration of lower inflation to one of recession. To reiterate, we would use any seasonal strength in the S&P 500, especially if we can test 4080 to move into more defensive recessionary areas or the All Weather portfolios (see here) or Dynamic Alpha (see here). If recession odds do increase, treasuries will be a much better alternative than the previous 12 months as most of the pain as already occurred. What triggered the yield curve breakout?
- Micron Technology (MU) said it was slashing capex by reducing DRAM and NAND wafer starts by about 20% versus 4Q 2022 in response to market conditions.
- More importantly the consumer is showing signs of cracking:
- Target (TGT) consumer are pulling back. “Clearly it’s an environment where consumers have been stressed,” said Target Chief Executive Brian Cornell on a call with reporters. Management said, consumers are waiting to purchase items until they spot a deal, buying smaller pack sizes and giving priority to family needs.
- While WMT – Walmart raised guidance and earnings seemed good enough yesterday. However, the low end consumer is spending down. Walmart said its lower-income customers swapped out deli meats for less expensive hot dogs and canned tuna.

Tuesday, November 15thToday’s softer than expected PPI across all line items saw the S&P 500 premarket trade 30 points from our 4,080 target to hit a high of 4,050. Even after the mid day sell off after a reported missile killing two Poland civilians the indexes closed very strongly. While markets await NATO’s response tomorrow, we doubt the response will result in any meaningful risk off event. Tactically the indexes remain constructive for more positive price action and any sizable dip in our opinion caused by Geopolitical risk will be bought into year end.
The PPI services print that caused a 50 S&P 500 rally premarket as seen below by Bloomberg came in negative for the first time since 2020. We believe a lot of this deflation was priced in as the dollar and treasuries really did not make significant moves until the late day Geopolitical risk off event.


Friday, November 11th
On the index level the markets seemed constructive, however, underneath the surface we had a massive momentum rotation out of defensive and inflationary stocks. This put significant pressure on Dynamic Alpha as the portfolio is heavily weighted to recessionary and inflationary equity plays. This is not unusual every 12 to 24 months if there is a regime change and initially slightly painful until the portfolio does make changes if deemed necessary. We would expect that Dynamic Alpha’s systematic process over the course of the next 3 weeks will slowly reduce some exposure to healthcare and inflationary stocks if this rotation continues at an accelerated pace.
- Inflationary plays like HSY (Hersey) saw a 2 Standard Deviation move to the downside today on no news, strictly as machines and traders are selling the inflationary stocks.
- Defensive cashflow plays like CAH (Cardinal Health), HUM (Humana), MCK (McKesson) saw a 3 Standard Deviation move to the downside today as health care was sold across the entire sector.
- The only inflationary sector that caught a bid was Energy as crude oil rallied on the back of another China reopening story.
- When stocks experience a 2 to 3 standard deviation move lower especially on a regime change these stocks will typically not participate on the upside and will slowly consolidate as a large theme is underway underneath the markets.
S&P 500 Model Update
One of the many reasons we were constructive on the S&P was the positioning of our S&P 500 model. We have now rallied from a -63 to a -22 and believe the model will get to a slightly positive reading before any reversal on the index. To reiterate as we have been discussing for the last month, the logical resistance level as seen from Thursday’s chart is roughly 4,100.
We will have to wait and see what developments both fundamentally, technically and Macro if and when we get there. If we are sitting at 4,100 into the Dec CPI print and we see another downside print, the S&P 500 could go parabolic into 4,300. This is not our base case, but certainly nothing is outside the realm. 4,100 is still a level that seems to warrant a more defensive stance to either raise cash, buy protection.

NASDAQ Update
As we discussed yesterday 12,600 (800 higher) on the NASDAQ (futures) would be an excellent level to reduce growth and technology exposure.

Thursday, November 10th
As we laid out in our bullish CPI case yesterday, that a .20bps to .30bps decline in headline consensus of 7.9% inflation would get the S&P 500 back to 3,900. Well the S&P 500 futures closed at 3,962 today. Keep in perspective today only saw a .20bps slightly softer CPI print to come in at 7.7%.
- Today the 60/40 portfolio jumped 3.4% today and only two times since 1988 has a 60/40 portfolio rallied more than 3%.
- The Terminal rate has now fallen from a high of 5.20% last week to 4.87% with the odds of a .75bos move in Dec a t 0% odds according to Bloomberg.
- According to Bloomberg today was the 3rd largest short squeeze on record.
- It now seems likely that every dip will be bought until the next CPI print as systematic traders are going to reengage to the long side. We can certainly see some back and fill from today’s massive 5.52% rally on the S&P 500. However, mechanically system traders will indiscriminately get long growth at this juncture after taking out 3,920 on the S&P 500 on a closing basis. We would not expect tomorrow to be a large give back day unless the S&P fails at 4,000.
Now, What We Expect?
We have not wavered from our October 6th commentary for a year end rally to 4,100 on the S&P 500 as we listed four strong catalysts, now make it a fifth. This level will certainly be an opportunity to rebalance into more defensive strategies, sectors or cheap protection. As measured by headline CPI, inflation still sitting at a whopping 7.7%, so unless we can get a meaningful decline in December, we do not see taking out 4,100 on a weekly basis to reach 4,300.
In the very near term, 3,998 on the S&P 500 (futures) is a formable resistance level and would expect some selling initially into this level.

Dynamic Alpha
This morning we added AMD (Semiconductor). However, we have no other exposure to technology. 80% of the portfolio is still defensively positioned within Healthcare, Consumer Goods and Energy. All these sectors will lag the S&P 500 if higher beta growth names continue on a deflationary belief. Unfortunately, for the interim Energy will struggle regardless if fundamentally cheap as long as inflation continues to decline and money will flow back temporarily into growth.
For clients or interested investors, click this link to access Dynamic Alpha tear sheet.

Wed, November 2nd
Fed alludes to a slowdown put no step down
Powell attempted today to thread an almost impossible needle. As we said yesterday, “we would not be surprised to see a disappointed market sell off into the close even if the Fed delivers an inline message, then a rally on Thursday”. See conclusion for levels we are looking for.
1.) The S&P 500 initially rallied 37 points based on the below statement of a potential slow down in the pace.
“The Committee anticipates that ongoing increases in the target range will be appropriate in order to attain a stance of monetary policy that is sufficiently restrictive to return inflation to 2 percent over time. In determining the pace of future increases in the target range, the Committee will take into account the cumulative tightening of monetary policy, the lags with which monetary policy affects economic activity and inflation, and economic and financial developments”
2.) However the gains quickly reversed as the S&P 500 fell 117 points from the highs of the day as the press conference was half way through.
Powell lost credibility as he doesn’t seem to have clear visibility on the lag effects of rising rates and the economic impact. Then what sealed the market’s fate was Powell suggesting that terminal rate might need to be higher than current projected levels to combat inflation that may be ingrained in the economy. Below was his exact statement regarding the terminal rate.
“We have some ways to go,” adding that the ultimate level of the terminal rate may be higher than previously expected. “The question of when to moderate the pace of increases is now much less important than the question of how high to raise rates and how long to keep monetary policy restrictive.”
As shown by Bloomberg, the Terminal rate hit new cycle highs of 5.10%.

Conclusion
The markets pulled forward a lot of return in the last 10 days and as we said 3,750 would be seen on a reversal lower. Investors might find entry around the 3,730 level on the S&P 500 to deploy capital IF underweight equities. However, we have jobs on Friday and a blow out number will put the S&P 500 looking at 3,677. After todays strong ADP we can expect the labor market to remain tight and strong.
Friday, October 28th
What an incredible rally from last night’s low on the S&P 500 of 3,760 to close today at 3,915, which is a 155 point (or a 4%) rally in 1 day. So why did we rally today after lackluster Mega Tech Earnings? Earnings were certainly not the catalyst as Apple really was not good regardless of the price reaction (or what the sell side analysts say) and Amazon’s highest margin highest and growth business (AWS) experienced margin compression.
Today’s Rally
Over the last two weeks we have listed 4 major medium term catalysts below for a melt up. In our opinion, discretionary traders have already tried front running a lot of these. Not mentioning our blended S&P 500 model was setting up for a counter trend rally. However, today was about options expiration more than anything else. Nomura’s Charlie McLligott Cross-Asset Macro strategist suggested the 0 to 1 days-to-expiration in U.S. Equities Index / ETF helped fuel today’s melt up. He pointed out that 64% of all SPX options trading today were 0 to 1 day expiration and 60% for all QQQ. Additionally, 13% of ALL SPX options had a strike of 3,900, 8% at 3,880 and 7% at 3,875 a total of 28% of all SPX options pegged 75 handles above the cash open! Between the quants and the options market, the market mechanics are exacerbating these large moves.
4,080 S&P 500?
The bottom-line is that every Central Bank has blinked. First it was the Fed, as we discussed, with their leaked message to the WSJ as they were worried about cracks in the credit market. Then, Canada lowered less than expected and then just today, the BOJ pivoted today reengaging in QE.
4 Positive Catalyst’s, but beware of the 4th!
- The largest corporate buy-back: A potential $190 billion to buy into year end. 75% of all S&P 500 companies can start buying Tuesday, November 1st.
- CTA’s have close to $170 billion of available capital to deploy to the long side according to Goldman.
- Stocks are under owned: BofA manager survey shows the highest cash level since April 2001. (Refer to Oct 18th post)
- The Fed Blinked but… This 4th catalyst is already getting priced in. As we already know, last Friday the Fed leaked to its mouth piece at the WST that the Fed is concerned with something breaking. The market took this as a sign of a dovish step down in their terminal rate. Although, a few inline to hotter inflation data points today like today’s PCE (inline) and ECI – Employment Costs Index (in-line), could dial back this message.
Today the S&P 500 futures settled at 3,919 as we have been discussing for several weeks a counter trend rally to 4,080 was in the cards. We have the Fed on Wednesday and consensus is at 75bps and 50bps there after. To get a rally to 4,080, the Fed must convey Nick Timiraos at the WSJ messagethat they are going to slow the pace and to give the economy time to digest the rate hikes, if not the market will be liquidated.
- If the Fed does message a set down or a so-called mini Pivot, 4,080 seems probable.
- If the Fed does not deliver this view of a step down and pulls the rug out from under investors, then the S&P 500 could easily trade back to 3,750 quickly. It will be a rather binary outcome.
Michael Hartnett of BofA who has been very good this year says it will take a 5.5% unemployment rate for a real Fed pivot for a collapse in inflation & payrolls. We have been saying without job destruction of large negative prints that we can not see a collapse in CPI. The Fed is in a tough spot because it can not pivot any time soon until the economy is progressively worse.
Today was not a Pivot, but a melt is coming!
For the last 2 weeks we have discussed three potential positive catalysts as to why a short term melt up was probable. Everyone knows these catalysts (see below) and they are old news. Now today, we can add a fourth positive catalyst to the list, a “Worried Fed”. Let us stress these are all short term catalysts and they do not change the broken Marco environment or the fundamental backdrop. Although ultimately even if the S&P 500 can test 4,080 on a year end rally, a retest of 3,503 is likely in 2023.
Four Positive Catalysts:
- The largest corporate buy-back black out period is over next Tuesday with a potential $190 billion to buy into year end.
- CTA’s have close to $170 billion of available capital to deploy to the long side according to Goldman. Goldman also says CTAs are currently short $22 billion of S&P and could flip with a 3,812 level on the S&P 500 futures.
- Stocks are under owned: BofA manager survey shows the highest cash level since April 2001. (Refer to Oct 18th to see chart.)
- The Fed is worried and blinked today:Today’s rally was all about a Fed that is concerned about breaking global financial markets, which we have discussed over the last few weeks. The Fed clearly panicked with their leaked message, however we do not believe this was intended to be a pivot and strictly an attempt to ease the Dollar’s euphoric rise which has unleashed stress across global markets. It is certainty too early to call for a pivot as inflation data has not even begun to decline in the most meaningful areas of wage and shelter inputs. However, the Fed blinked today as stocks surged off the back of the Fed whisperer Nick Timiraos at the WSJ who relayed a Fed message that future rate hikes are being questioned. Then, after this leaked measure from the WSJ, Mary Daly of the Fed came out saying the Fed might be moving too fast and she even mentioned that the Fed could break something and could cause contagion in a worldwide Dollar shortage. So why today did the Fed panic with this leak? In our opinion, the Fed panicked as the Bank of Japan and the Swiss National Bank both in the last two days needed to inject roughly $50 billion of US dollars. The world is being squeezed with the lack of USD. Essentially, the Fed needs to get the dollar down and ease financial conditions as other sovereign nations are getting squeezed. However, the issue is that the Fed is attempting to jawbone down rates and the Dollar to avoid breaking financial markets while at the same time, trying to combat inflation. So the markets can welcome this in the short term, but make no mistake, inflation is not on the decline yet.
Positioning is everything in a bear market squeeze
Below is a great chart from Goldman showing the Goldman Sachs Prime Brokerage Long/Short ratio to S&P 500 open call interest. Investors. The second chart provided by Goldman shows that hedging protection has been almost expensive since 2008. Everyone is positioned for lower levels.


Dynamic Alpha
Dynamic Alpha is in a high level of cash, roughly 14%. While there are few stocks within the S&P 500 that are showing evidence of constructive price behavior where they meet our buy requirements, our S&P 500 blended model overlay currently will not allow the strategy to buy just yet. This could change this week if a melt up does occur and lifts the restriction on the S&P 500 overlay. While we can not catch the tops or bottoms of a market, we do believe over the long term our process is far superior to anything in the long only space.
Dynamic Alpha has out-performed the S&P 500 by 2.43% on an annualized basis while outperforming EVERY MAJOR S&P 500 drawdown over the last 7.8 years.

Past performance is not indicative of future results. Fees are based on .28% annualized. Dynamic Alpha benchmarks to the S&P 500 even though the strategy is designed to be benchmark agnostic.
2022 Drawdown Risk

Past Performance indicative of futures returns2020 Drawdown Risk

Past Performance indicative of futures returns2018 Drawdown Risk

Past Performance indicative of futures returns2016 Drawdown Risk

Past Performance indicative of futures returnsDynamic Alpha has out-performed
the S&P 500’s 16 worst months 80% of the time.

Past Performance indicative of futures returns
Tuesday, Oct 17th
Bottom-line.. there is no demand destruction yet and therefore there is no peak inflation
It is only Tuesday and we have made moves on the index level that historically take weeks if not months to make.
- Today the S&P 500 rallied 80 handles before almost going flat on the day to close up 44 points.
- The NASDAQ futures were up 300 points at the open before going red 30 points to close up 100.
- Mid day news of Apple (potentially) telling suppliers to halt production sent the NASDAQ down, however, the strength across the index in our opinion remained strong.
- Earnings:
- Netflix reported earnings and after hours the stock is trading up 14% as the company’s subscriber growth crushed expectations by 1.3 million coming in at 2.4 million new subs. While this is a company secular specific story, consumer demand here is not slowing!
- United Airlines is trading up 7.5% after earnings as the company reported all time revenue and profit quarter, consumer demand here is not slowing even though it was widely anticipated travel demand remains strong!
- Macro View: It’s still hard to make an argument for peak inflation when consumer demand remains as we are witnessing this earnings quarter. Without job losses there will be no consumer demand destruction and NO Peak Inflation:
- We have been saying earnings risk was not to the downside as S&P 500 EPS was already sliced by 7% for Q3. While earnings are clearly coming in much better than expected of late, like NFLX, UAL, GS, BAC, it’s also an indication that inflation is not slowing down as the consumer demand remains intact because jobs remain unrelentingly strong. Until we start seeing large negative print on Non Farm Payroll, inflation has yet to peak.
- We can see a scenario where we continue to rally in the short term as earnings are better than feared as jobs remain strong. Although, reality will once again set in that inflation is not breaking until the labor market breaks and then we get a real sustainable rally as the Fed will need to Pivot.
- Below is a good chart provided by Deutsche Bank, showing 14 Fed hiking cycles since 1950’s and the unemployment rate and current forecast.

Current Set UpNo one is invested, S&P 500 historically still oversold and record buy backs start next week.
- According to the first chart below, B of A Global Fund Manager Survey, the FMS average cash level has not been this high since Oct 2002.
- The second chart provided by BofA Global Research Investors is now a 3-signa underweight equities, far greater than the full blown panic during the peak global financial crisis.
- Refer to yesterdays note on the potential level on the S&P 500 for this bear market rally.


Monday, Oct 17th
Today’s 2.60% move higher on the S&P 500 was nothing more than a delta squeeze as hedge funds and sophisticated investors were squeezed based on Thursday and Friday’s positioning. Nothing fundamental or earnings related was the catalyst. However, as we know all initially rallies start with short covering.
One important thing to point out that could be a very positive catalyst for the equity markets is corporate buybacks. The blackout period is over next Oct 25th and companies can start buying back authorized repurchases. This will put a strong bid underneath the market as it is going to be the largest authorized repurchase of corporate buybacks in history. If this does firm up the market in early Nov, in our opinion this could lead to a yearend rally taking the S&P 500 to 4,080, which will ultimately fail and retest 3,500 in Q1 2023.
A few highlights:
- Buy back volumes might be elevated as new tax rules take effect in 2023 on corporate buybacks. Corporates may front load heavy repurchases before year end because of the tax changes in 2023.
- There is $190 billion of repurchases in the last two months of 2022 or $4.5 billion every day, which is said to be front loaded in November, which we cannot verify.
- Below is a corporate buy back chart going back to 2005 from GS Global Markets, Birinyi Associates and Bloomberg. You can see why this could be a very positive catalyst on the market.

Earnings Season has Begun
Earning season is underway and we don’t believe it will present a downside risk as investors already know how bad EPS cuts have been. This chart provided by Deutsche Bank shows how big this earnings season cuts have been relative to the last 12 years. The only thing that matters now is jobs which in return controls wages inflation, thus liquidity from interest rates. With the jobs market so resilient, earnings will come in most likely better than feared. Until Non Farm Payrolls start losing jobs to fight wage inflation, earnings are not going to completely blow up unless it is more of a dollar story.

Where can a Bear Rally take the S&P 500?
On Oct 6th we stated we don’t attempt to predict or forecast longer term price moves, although a bear market rally to 4,100 is possible as everyone is positioned so negatively for lower levels. With the current positioning of hedge funds and under weight positioning from CTAs/Global Macro (based Goldman flows). It is certainly possible a massive year end rally would take the S&P 500 back to 4,100, which would be an opportunity to sell unless inflation has structurally changed for the better as the Fed pivots.
Bottomline, positioning has not changed and with $190 billion in capital inflows available to backstop the market, this could cause some real pain to the upside for those off sides.

Saturday, Oct 15th
Last week investors endured one of the most volatile periods since March of 2020. The matter of fact is when liquidity becomes an issue, volatility becomes more pronounced than ever before. The structure of the markets are very different from only a decade ago, largely because there is more capital allocated to quantitative funds which strictly invest based upon price as a signal. Then you have derivatives and options that are more widely used than ever that cause gamma disruption (squeezes) by dealers to hedge.
We were highly critical of Thursday’s rally as financial conditions actually worsened within credit and fixed income spreads. We also said a close above the short term important resistance level on the S&P 500 futures of 3,740 would have caused more buying. The S&P 500 futures premarket traded as high as 3,734, before reversing 140 points on the day.
As we pointed out at the bottom of our last email on Thursday, Goldman referenced that $1 trillion worth of puts were to be struck at 3,500 on the S&P 500 futures. The largest ever! This caused a massive amount of buying once the S&P 500 ticked 3,503.

So where are we now?
We have been saying for a while we believe there was a high probability for months that our S&P 500 blended model would get close to a -74. The model is currently reading a -66.50 and has not moved much at all over the last two weeks. A move from -66 to -74 would be roughly another 4% to 6% lower on the index.
This means that the massive support level of 3,500 on the S&P 500 will likely not hold and 3,400 could be in range. As we discussed before, this type of trigger may allow Dynamic Alpha to re-engage slightly to allocating again, but certainly not 100%.
Based on the data below, we can estimate that a reading between -74 yo -78 will cause a large counter trend rally that might outweigh the risks to deploy cash. However, since 1992 the lowest readings of -93 and -89 were caused by a systemic shock to the system which can’t be ruled out. While this can’t be ruled out as we have never seen this type of liquidity drained from the system, something is bound to break before there is a catalyst to save the markets.
Click to enlarge

Hedge fund Flows
The below chart reference by JP Morgan shows that net flows from US hedge funds are certainly negative, but no way near the June 2020 lows.


Thursday, October 13th
A draw dropping 207 S&P 500 handle reversal on a hotter than expected CPI print! As we pointed out yesterday in our base case of a Stronger CPI Print: If the headline is above 8.29% and core 6.6%, the S&P 500 could easily test 3,500 & NASDAQ (futures) 10,490 with no signs of a pivot in sight. A .20% increase on both headline and core, could actually put the 3,500 level in significant jeopardy of holding on a Friday close. Ultimately, 3,380 is in the cards if this is the outcome.
The S&P 500 futures reached both our targets on the S&P 500 and NASDAQ (Futures) of 3,502 and 10,484 respectively. However, a massive counter trend reversal came into play caused by 1.) extreme pre-positioning from hedge funds and CTA’s and 2.) Massive support at 3,500 that we have been discussing for several months.
Remember one thing, when there is no visibility into earnings like the current environment, the Macro backdrop dictates the short term pricing of markets. Short term price direction is 100% driven by technicals and nothing else. This is why it is so important in understanding CTA positioning that relies on price trends. Don’t be fooled by strategists if they change their narrative of today’s events. In our opinion, there was simply no other factor that caused today’s counter trend reversal besides technical positioning. Fundamental conditions got worse in fact as financial conditions got tighter as we saw a significant bear steepening of the 2/10 yield spread of to .52bps.
- We tested the 3,502 level on the futures that we have repetitively over the last five weeks mentioned as significant support. We said back on September 22nd, “3,500 has a tremendous amount of supply and demand that took 5 months to breakout at this level” (see yellow dotted lines below)

- Hedge funds significantly de-risked and delivered for the last several months. As seen below by the chart provided by Goldman Sachs Prime Broker Hedge funds net positioning is about as low as it has been in 2 years. know one is long or levered.

- The Market was completely Hedged: According to Goldman there was $1 trillion of 5-day rolling average notional of index puts, the highest ever. This caused a backstop.
- CTA’s (Trend Following quants or Global Macro have according to Goldman Sachs $160 billion to buy in an upmarket. While they don’t define what an up market is exactly, we can surmise they have a lot of cash to buy if they flip to buying. Today was nothing more than an old school key reversal and that could cause more buying if we get a weekly close above 3.740 on the S&P 500 futures), which will have much more room to run as funds are significantly under allocated to the long side.
- ECB headlines also helped firm up the market, while we would put this at the least important factor for today’s rally. Reuters reported that an ECB staff model sees a target-consistent terminal rate of 2.25%, beneath the 3.0% level that markets are currently pricing in, however, policymakers are skeptical.
All Weather Conservative: Remains in 21% in cash.
All Weather Moderate: Remains in 32% in cash.
Wed, October 12th
We all know tomorrow is the all important CPI, much more important than today’s PPI which was up .20% and the market really had a muted reaction. First and foremost is the wage input then shelter inflation will be the key data points. While energy and food are of course important this is not what the market cares about. Wage inflation is what drives all inflationary pressure and to get wage inflation down and the Fed to pivot, the market needs job losses.
It is a foregone conclusion that the Fed is moving 75bps in three weeks. However, what is going to impact the next 6% up or down on the S&P is tomorrow’s CPI. Consensus for tomorrow is 8.1% for Headline and 6.5% for Core.
Here is our guesstimate for the markets reaction:
- Inline: If the headline is in-line at 8.1% and core is 6.5%, with no signs of wage gains the market will see volatility, but will not trigger any meaningful closing declines in the indexes. We would expect a bounce off the S&P 500 lows if the index tested 3,571.
- Slightly weaker: If the headline is slightly less than 8.10 to 8.00% and core is less than 6.5% to 6.40%, the S&P 500 could have a relief rally trade to 3,658 & NASDAQ (futures) 10,970. Yet this does absolutely nothing in terms of the Fed’s decision. So reducing long equity exposure seems warranted on an intermediate term basis.
- Very Weak: If the headline is below 7.90% and core is less than 6.3%, the S&P 500 could trade to 3,733 & NASDAQ (futures) 11,480 over the next two days on the perception that a pivot is now back on the table. Yet this does absolutely nothing in terms of the Fed’s decision in reality. So it might be worth reducing exposure if the indexes reach these levels..
- Stronger: If the headline is above 8.29% and core 6.6%, the S&P 500 could easily test 3,500 & NASDAQ (futures) 10,490 with no signs of a pivot in sight. A .20% increase on both headline and core, could actually put the 3,500 level in significant jeopardy of holding on a Friday close. Ultimately, 3,380 is in the cards if this is the outcome.
The only positive thing going for this current set up is the market is pricing in a slightly stronger CPI tomorrow and the markets are oversold. So any meaningful decline in CPI will be one of 2022 largest rallies.
Tuesday, October 11th
Wow, that was a very interesting day. Let’s take a look at the chain of events.
- S&P 500 almost retested last week’s lows of 3,571 hitting 3,581 early morning.
- Then as the S&P 500 was trying to break to the lows of 2022 then the NY Fed Inflation expectation report at 11:00 crashed. This rallied the S&P 500 65 points off the lows and green 25 handles. This was a warm welcome as this led market participants to believe a lighter CPI print was in the cards for Thursday. However weaker inflation expectations came at the expense of household spending, which cratered THE MOST ON RECORD! This once again eased financial conditions and lowered rate expectations. So obviously the market cares more about inflation data than a weakening consumer.
- Then around 2:30 when the market was on stable footing the BOE tried playing tough. Baily of the BOE said the following that reversed the S&P 500 by almost 60 handles.“My message to the funds involved and all the firms is you’ve got three days left now,” “You’ve got to get this done. The essence of financial stability is that it (intervention) is temporary. It’s not prolonged.”
Let me first say, yes this is a serious credit risk, however, we do not believe for a second the BOE has the guts to follow through causing a significant credit event. Bailey wants to make sure he is being taken seriously by the Pensions. The Pensions need to sell and stop refusing to hit the offers, and take the loss on the Gilts. It’s a tough message for these Pension to hit the sell button and take down exposure.
In our opinion, the market is feeling the stress and this is noise. If we are going lower, this is not the main catalyst and will be just one of many results of the larger liquidity drain on the system. While tomorrow will be most likely a risk off event in European markets, the S&P 500 did close 25 handles off its lows once again at 3,600.
Friday, October 7th
A Credit Risk Event Is Growing Even Greater!
Today’s strong jobs data was of serious concern for credit markets as it puts us one step closer to a credit risk event as we discussed on September 30th. The Fed is stuck after today’s job number and unless CPI comes in softer next week, a true risk off event is increasing.
What We Already Know, But Will Discuss Anyway
Once again, a very strong labor market crushed the hopes and dreams of a Fed pivot for investors. As we have discussed several times, to crack wage inflation which is the most important component in CPI, we have estimated that the labor market will need over 1 million NFP job losses. A far cry from today’s 256,000 gain.
There Is Still Too Much Leverage and Liquidity
For our readers who have been carefully reading our work, you know we have been discussing how it would be almost impossible to drain this liquidity without investors getting hurt. That is why we have been emphasizing allocating to absolute return strategies as much as possible in your overall allocation. In the U.S. alone, over $14 trillion between monetary and fiscal stimulus was infused into the economy. To give you the scoop of this liquidity issue, globally there was $80 trillion of fiscal stimulus poured onto a Global world market cap of $88 trillion in 2022.
This caused the largest valuation bubble based on GDP to S&P 500 valuations since 1929 as seen below (click image to enlarge). The good news is valuations have contracted significantly. The bad news is the S&P 500 to GDP ratio is still sitting at the highs of 2000. This does not mean or suggest the S&P 500 or NASDAQ will see an analog to 2000. The 2000 and 2022 periods have a completely different economic and fundamental backdrop as we have shown in previous research.
Liquidity Liquidity and Still Liquidity
To put this in perspective, the second chart from the Fed’s balance sheet is still $8.759 trillion only down from $8.95 trillion. While we cannot forecast how this plays out just yet, we can certainly surmise this needs to move lower to drain both liquidity and inflation and a terminal rate between 4.30% to last week’s high of 4.80% might not cut it.

Feds Current Balance Sheets

So Now What?
As we said yesterday, today’s NFP number was going to be a binary event and it was nothing short of that. We mentioned yesterday, “Anything above consensus 250,000 and the S&P 500 could test 3,711”. Well, the index blew right through 3,711 like a hot knife in butter to close at 3.650. Monday or Tuesday we would suspect the market will attempt a retest last Sunday’s lows in the S&P 500 futures of 3,573. (June’s lows are NULL& VOID and irrelevant now).
Additionally, 3,573 is not a significant level and it is doubtful that it will hold. We have been discussing for the last 2 months that the very large support level of this cycle was 3,500 seemed probable. Based on very rudimentary technical analysis the longer the base of a large break out the more supply and demand is established around that breakout level. This is why the 3,500 seen below has a lot of support as it took 4.5 months to break out here.
Dynamic Alpha & Our S&P 500 Model
Dynamic Alpha is roughly in 76% cash. For Dynamic Alpha to start looking for stocks to buy, there are a number of signals that have to be triggered within our blended S&P 500 model.
- To aggressively allocate to equities, Dynamic Alpha needs to see the model significantly more negative like 2001, 2002, 2008, 2018 and 2022. (You can see this better if you click the chart).
- Dynamic Alpha will take a less aggressive approach and slowly allocate if the model does not decline but starts to slowly increase.
- We believe this process can present a very nice opportunity for our investors in Dynamic Alpha.
- Dynamic Alpha does not look at levels or time markets. As we have mentioned previously, we do not believe 3,500 on the S&P 500 will get us close to a -74 or lower on our S&P 500 model. Dynamic Alpha does not invest based upon levels and strictly uses our models to guide our process. We are only highlighting important levels within the markets as a guide for your own reference point and you should use your own discretion.

Credit Blow Up?
On September 30th we said there were only 2 ways out of this deleveraging cycle and one would be a credit risk event that will take much longer to recover, but a greater opportunity to get long. Today’s strong jobs data was of serious concern as it puts us one step close to a credit risk as the Fed really has their back against the wall.
“Any type of credit risk event will completely change the dynamics of any possible rally off of 3,500. This would play out similarly to what happened with the BOE this week. If the markets do experience a credit event or a systematic VAR shock, it is very fathomable to see the S&P 500 retrace to where it originally failed in January of 2020 at 3,300. I would expect any credit risk event to be very bullish and buy 3,300 because the market will price in or force the Fed to expect to slow down the pace of tightening and create a market put and pivot. So for very nimble and tactical allocators, 3,500 might warrant risk taking if you have cash to start nibbling. Just keep in mind a systemic shock within the debt or credit markets will take the index down to 3,300 where a Fed pivot will be a massive bullish level. Something is bound to break under this tightening backdrop. There is absolutely no visibility into consensus earnings so don’t attempt to apply a multiple to the S&P 500 right now, the variance is just too wide of a gap”.
Below is a great chart provided by BofA Merrill Lynch showing how EVERY Fed tightening cycles ends. While we have already contracted by 27% of the S&P 500 multiple and a lot has been priced in, we have yet to see a shock that is accustomed to the end of a tightening cycle.

Thursday Oct 6th
Big Day tomorrow
Tomorrow will be a binary event with the Non Farm Payroll data. Between this week’s Jolts, ISM, Initial Claims and ADP, there was no clarity on tomorrow’s NFP. ADP was stronger than expected with wage growth, however, ADP doesn’t correlate that well with NFP. Anything under 200,000 jobs created will get the S&P 500 in our opinion, to test 3850 or a 2% move higher based on the time of this note. Anything above consensus 250,000 and the S&P 500 could test 3,711.
As we have said before to truly get wage inflation to contract the market is going to need to see 1 million plus NFP losses. So while the markets will celebrate a sub 200,000 number If we get it, in reality, it’s not going to impact core PCE or CPI until we see significant job losses. There has been too much money supply and government stimulus liquidity infused into the system. This doesn’t mean the S&P 500 cant get well ahead of reality and trade back into the longer term downward slope of 4,100 if NFP & CPI come in light.
While we don’t predict or attempt to forecast a bear rally to 4,100, everyone is positioned still for lower levels. Until we start to see growth and inflation start to decline together, we won’t see a longer term sustainable rally. Once growth significantly starts to slow reflected in earnings, that will ultimately be the signal for the Fed to ease and stop tightening. This would be a far more optimal outcome than the Fed pivoting because a credit risk event occurs that will take longer for prices to stabilize.

The biggest unknown variable is what is the E in the current S&P 500 multiple as shown in the chart Goldman has published. We have seen a 27% compression in the multiple already in 2022 which is not that far off from the historical compression in a bear market. However, we can also argue we have never seen multiples expand like this before caused from a $9 trillion balance sheet expansion.

S&P 500 Blended Model
Our S&P 500 blended model hasn’t really budged after the 200 S&P 500 rally in the last few days. So no one is positioned for a continued rally, which is a significant miss to the downside in NFP and CPI, this market will get a massive bear market rally in the short term. Longer term, that E is likely to compress further, which is what the Fed needs to stop the tightening.

Tuesday Oct 5th
Not too much to report today, but we wanted to point out a few items.
Dynamic Alpha: Our S&P 500 model has not budged off the current reading over the last 2 days vicious rally. So unless the model starts significantly improving, it does not look like we will be allocating to any new positions in the short term.
Strong Buy to Strong Sell Model: Even if Dynamic Alpha could allocate capital, there are only about 20 stocks within the S&P 500 that our models are very constructive on as seen below by our Strong Buy to Strong Sell Ratio. The number of Strong Buys fell below the number of Strong Sells on August 22nd and diverged significantly. This is almost always a risk off event. Conversely, rarely does the number of strong sells remain 95% before a nice bounce.

The Dollar: As we mentioned 5 or 6 weeks ago, the DXY must reject $114 on a weekly close and it did just that, causing a lot of selling. If the DXY closes below $109.80, this will provide continued support for equities.
JOLTS: The Jolts data was revised down and showed weakness in almost every category of the labor market, which was one of the largest catalysts at 10am to cause a significant rally in equities. This is leading up to the jobs number on Friday, so traders most likely think the data will be weak and bullish for stocks.
FED Heads: If you remember in July every Fed official leading up into Jackson Hole was trying to jawbone the market down into reality. We are seeing that rhetoric again and like before the market doesn’t care.
- Fed’s Jefferson (voter) said the Fed is resolute on bringing inflation back to 2% and is committed to taking further steps necessary. Jefferson said elevated inflation is the problem that concerns him the most, while he added that restoring price stability may take some time and will likely entail a period of below-trend growth.
- Fed’s Daly (2024 voter) repeated that the Fed is committed to getting inflation down, while she added further rate hikes are needed and they are to hold policies there until they are truly done with getting inflation down. Fed’s Daly also suggested they have to understand and take into account the impact of rising rates and dollar strength on global financial conditions so that they don’t end up overtightening policy.
Monday 3rd
Well that escalated quickly as once AGAIN markets price in a Fed Pivot.
As we said last Thursday, “Consensus views don’t generate alpha”. For regular readers, you know that we say, when markets reach extremes,human behavior always tries to change to fit the narrative.
Well, consensus turned apocalyptic enough for the narrative to change. Data provided by Bloomberg showed that the terminal rate fell to 4.38% today vs. Friday’s 4.52% and almost hitting 4.80% last Wednesday before rates started pricing in a cut “pivot” for 2023. As we said on Friday, a negative credit event would cause a Fed put. Well that never happened however, over the weekend, you had several banks saying the same thing. In our opinion, this helped put a bid underneath the market early in the morning today and eased financial conditions significantly.
The narrative always changes when the markets get that oversold. This new narrative is “The Fed is about to break something” and they must ease back on its aggressive stance before it does. This helped the S&P 500 bounce off the big 200 weekly moving average last night at 3,575 as the dollar and yields fell, easing financial conditions. This coupled with a very weak ISM that indicated job contraction sent the indexes up even more and the 10 year yield dropping .26bps the first time this year and the second time in over 10 years according to Bloomberg.
Unfortunately, the S&P 500 never reached our 3,500 where we suggested allocating capital was warranted. Nor did our S&P 500 model reach -70 from the current -64 reading. As for now, our allocations remain unchanged. If economic data continues to contract like today’s ISM, the risk of a massive year end rally and HOPEFUL pivot will grow. Earnings will not matter as the market at this juncture expects earnings carnage.
As for reducing risk, the S&P 500 and NASDAQ are too far away from upside resistance to think about reducing any exposure just yet. The NASDAQ (futures) would have to get close to 12,900 and the S&P 500 back to 3,850 to reduce exposure. Otherwise, we would look to 3,500 still as a major support level that would be constructive to add equity exposure to one’s allocation.
Lastly, if you are wondering if today was a real rally, this chart provided by Bloomberg shows just how much markets believe rates need to ease. The terminal rate dropped .45bps from its highs last week as the market believes the Fed is going to pivot. The last pivot didn’t work so well, so be careful of chasing this new narrative by adding risk.

Friday September 30th
We are pleased to report another strong relative outperformance in a weak equity and bond market. Here are the estimated returns for the following strategies. (Friday’s commentary is below the performance.)
September Performance
All Weather Conservative* -3.11%
60/40 Allocation** -7.20%
Outperformance -4.10%
All Weather Moderate* -3.72%
80/20 Allocation*** -8.22%
Outperformance -4.49%
Dynamic Alpha* -5.09%
S&P 500 -9.35%
Outperformance -4.26%
If you have not explored the All Weather Alternative models, now is the time.
* Estimated
** 60/40 is SPY/AGG. All Weather Conservative is benchmarked to 60/40 as both historically generate a similar return profile. There can be no assurances in the future similar returns will be achieved. Results are net of fees and transaction costs.
*** 80/20 is SPY/AGG. All Weather Moderate is benchmarked to 80/20 as both historically generate a similar return profile. There can be no assurances in the future similar returns will be achieved. Results are net of fees and transaction costs.
Past performance is not indicative of future returns
Friday, September 30th
Things tend to break under stress!!!
The moment of truth is upon us. Based on today’s close on the S&P 500 (Friday 29th) it seems likely that Monday or Tuesday could be short term capitulation. While we have no idea if the S&P will ultimately hold 3,500 (futures) on a longer term basis, it does seem probable that buyers will start to nibble at this level. This is without mentioning a credit risk event. Any type of credit risk event will completely change the dynamics of any possible rally off of 3,500. This would play out similarly to what happen with the BOE this week. If the markets do experience a credit event or a systematic VAR shock, it is very fathomable to see the S&P 500 retrace to where it originally failed in January of 2020 at 3,300. I would expect any credit risk event to be very bullish and buying 3,300 because the market will price in or force the Fed to except to slow down the pace of tightening and create a market put and pivot. So for very nimble and tactical allocators, 3,500 might warrant risk taking if you have cash to start nibbling. Just keep in mind a systemic shock within the debt or credit markets will take the index down to 3,300 where a Fed pivot will be a massive bullish level. Something is bound to break under this tightening backdrop. There is absolutely no visibility into consensus earnings so don’t attempt to apply a multiple to the S&P 500 right now, the variance is just to wide of a gap.
S&P 500
The only reason we don’t have higher conviction with 3,500 is that our S&P 500 model is currently only reading a -64 and 3,500 will most likely only take the reading to -68. The average lower range is roughly -73, which will put the index around 3,425. These moves certainly cannot be timed with precession, especially under duress; however, we can take calculated risk for potential expected returns. Lastly, buying long exposure should be done via ETFs and not individual stocks as we are heading into the heart of earnings season. It will be much too difficult to navigate the tape bombs like what we saw most notably with NKE, CCL, KMX and FEDX. The typical textbook play for a counter trend rally will be semis and more cyclically sensitive sectors like XLY after their final push lower. Semis have been firming up, however, a glut of supply is a major concern especially in the lower end commoditized market.

Our S&P 500 Rating Value
As we wrote this past Monday our S&P 500 rating value reached a level that we needed to de-risk the portfolio significantly. As of now Dynamic Alpha is about 70% in cash. Please note: the S&P 500 rating value is different from our S&P 500 blended model.
All 5 periods below saw the same rating value decline to a -100 that our S&P 500 rating value model experienced on Monday. Please keep in mind that this does not mean that this time the markets will experience similar behavior. Five occurrences over a 30-year period is not that statistically significant, although it is enough to take down risk to 50%.
- 2.28.2001 with a following decline of 10%, decline took 25 days
- 9.7.2001 with a following decline of 9%, decline took 15 days
- 6.28.2002 with a following decline 19%, decline took 18 days
- 9.10.2002 with a following decline of 6% decline took 16 days
- 6.27.2008 with a following decline of 28%, decline took 60 days

Thursday, September 29th
Remember…Consensus views don’t generate alpha!
Long term forecasting is an impossible endeavor, especially now with no earnings visibility. For as long as we have been systematic investors we have always said never get too bullish or bearish because your judgement will be clouded by your emotions. On a non-systematic point of view, we were bearish 12 to 18 months ago as we believed the Fed doubling its balance sheet and driving the S&P 500 to a 22.50 multiple was a great mistake. However, we did not allow our human biases to get in the way of opportunity for Dynamic Alpha to generate a 32.50% return in 2021. Throughout 2021, Dynamic Alpha was 70% tilted toward growth and took that exposure down to 15% by early November and for a total of 5% by early December and then turned significantly more defensive in early 2022.
We now welcome market pundits and strategists who just recently have jumped on the bandwagon calling for the S&P 500 to trade down to 3,000. Our S&P 500 model (see below) is not yet at a historically oversold reading that warrants Dynamic Alpha taking additional risk yet. As the consensus view turns towards 3,100 on the S&P 500, this will allow for prices to reach extreme oversold levels and capitulation to ultimately create great opportunity to take risk.
Not to beat up on Goldman Sachs (GS), but coming into 2022 they were calling for 4,900, which was almost in line with most consensus of the large banks (except Morgan Stanley and one department of Bank of America). As you will recall from our note, GS lowered their target to 4,300 in mid 2022 and just last week lowered it to 3,600 with a base case recession level of 3,150. Our point here is to follow a process and don’t let sell-side research cloud your judgement so you can remove the noise.

Our S&P 500 Short Term View
We said on September 22nd that we are looking for our S&P 500 model to reach a -70 as a place to add risk, which would put the S&P 500 potentially at 3,500. While we have no idea if 3,500 will be reached or if it will hold, here are a few data points to consider. 1) 3,500 has a tremendous amount of supply and demand that took 5 months to breakout at this level (see yellow box below). 2) 3,500 should get our S&P 500 model to roughly -66. While -66 is not going to be the highest conviction in terms of extremally oversold it could be constructive.
In summary, we welcome lower prices as it will ultimately be an opportunity regardless if it is shorter or longer term in nature for Dynamic Alpha.


Wednesday, September 28th
Was today a game changer after making new lows for 2022 on the S&P 500 (futures) last night? Only if you believe the Fed will follow the BOE!!!
The Bank of England just completely caved on (QT) Quantitative Tightening after seeing liquidity problems and sited “significant repricing of UK and global financial assets”. Most likely the real issue was UK pension funds had been forced to sell their gilt exposure causing a real issue in the UK financial system. Essentially, in a nut shell the UK markets are so fragile that the BOE had to start QE even before they got QT underway! This should tell you just how difficult it will be to unwind all this liquidity in the greatest liquidity bubble investors have ever seen. If you don’t think this is the largest liquidity bubble EVER, look a the chart below we have sent out many times before of both public and private U.S. companies valuations to GDP.

This easing of financial conditions lead to the S&P 500 reversing the overnight lows by 130 points and the NASDAQ almost 430 as the dollar tumbled and yields slid. The DXY as we discussed was rejected at that important $114 level and the 10 year yield fell -5.30% from 4% to 3.73%. For market participants who believe that the Fed could follow a similar outcome as the BOE, it doesn’t seem that probable, but never say never. The BOE typically is not the leader in Central banks and their balance sheet is smaller than the Fed’s. The only central bank in the world that is still increasing liquidity is China.

Meanwhile, the index’s were getting to an oversold level. So any easing of financial conditions like today in both rates and the dollar would have caused a short term rally in equities and bonds. Although, this should be seen as an opportunity to de-risk equity exposure in our opinion if you are 100% long. We will discuss IF and when this opportunity arises to reduce more risk exposure. Today’s move with the BOE was almost expected as this is the fastest pace of global rate hikes in 40 years, something was and is bound to break in financial markets under these conditions.

Dynamic Alpha Update 9.28.2022
Dynamic Alpha is now in 62% cash with the following holdings. Furthermore, Dynamic Alpha is currently not allowed to allocate to new holdings unless the following metrics are triggered.
1.) S&P 500 model moves back above -50
2.) S&P 500 model is below -72 for 8 days with no decline in the model.
3.) S&P 500 model is below -60 with 1 increase greater than 2.00.
CAH — Cardinal Health Inc
HUM — Humana Inc
GPC — Genuine Parts Co
LW — Lamb Weston Holdings Inc
MCK — McKesson Corp
NOC — Northrop Grumman Corp
ON — ON Semiconductor Corp
REGN — Regeneron Pharmaceuticals
RSG — Republic Services
SBUX — Starbucks Corp
TMUS — T-Mobile US Inc
UNM — Unum Group
WM — Waste Management
Monday, September 26th
We want to give you an update on Dynamic Alpha that we are liquidating 25% of our equities and raising cash to 53% as our rating value for the S&P 500 hit a level that triggers continued market duress. This rating value is only one of our S&P 500 models that measures strength. Our mean reversion model is actually not yet showing significant and eminent market breakdown just yet.
All 5 periods below saw the same rating value decline that our S&P 500 rating value model experienced today. Please keep in mind that this does not mean that this time the markets will experience similar behavior. Five occurrences over a 30-year period is not that statistically significant, although it is enough to take down risk to 50%.
- 2.28.2001 with a following decline of 10%, decline took 25 days
- 9.7.2001 with a following decline of 9%, decline took 15 days
- 6.28.2002 with a following decline 19%, decline took 18 days
- 9.10.2002 with a following decline of 6% decline took 16 days
- 6.27.2008 with a following decline of 28%, decline took 60 days
2008 took much longer to breakdown as the market was actually much stronger when our S&P 500 model triggered this current signal and not under as much duress as 2001 and 2002. We do not believe 2008 is a similar analog as 2022 in terms of credit, economic data or earnings, although trend and mean reversion patterns do seem to be tightly correlation to 2008.
In summary, Dynamic Alpha is now heavily derisking and will wait until our models find greater risk-to-reward opportunities to get long for a recovery. Remember, Dynamic Alpha is not a tactical strategy and will not be looking for other asset classes to deploy capital. Historically, the strategy will reallocate heavily towards cyclicals, growth and higher beta once that bottoming process does start to occur from lower levels.
Please feel free to contact me direct to discuss this at 917.653.3153.
Brett Golden
Updated Saturday, September 24th
This was a very tough week across all asset classes and global markets. However, a few absolute return strategies held up relatively well. Here are a few strategy sleeves that held up within our All Weather Models and their estimated weekly performance.
- Managed Futures +4.71%
- Merger Arb -0.23%
- Convertible Arb -1.38%
Yesterday, we said a retest on the indexes was in the cards which was pretty obvious. Today the S&P 500 (futures) reached 3,660, 20 points from the 3640 retest.
Here Are Today’s Chain of Negative Catalysts
- Strong Dollar: It is only getting stronger as the rest of the world sinks into the abyss. We stated on August 19th that the U.S. dollar was lining up to be a strong headwind for both technology and multinationals.The dollar took out our upper price target on DXY of $12.50 today, reaching a high of $113.19. Furthermore, we said Gold would be negatively impacted based on this potential breakout of the dollar. We said that this would impact Large companies like MSFT and other technology companies as their deferred revenue would be subject to negative currency hedging. This is a serious issue more so in the short term than even rates themselves. The DXY is about to go parabolic if we get a weekly close above $114 as there is little longer term resistance until 2001’s highs of $119 as seen below. This will cause destruction within shorter term earnings. IMPORTANT NOTE: At $119 on DXY which will cause massive price destruction, will also all bring great opportunity to get long Emerging Markets. While we are not an advocate of including Emerging Markets within an asset allocation matrix, as the risk/reward is extremally weak and does not enhance the efficiency of ones allocation, this could generate some alpha on a tactically basis it over a 6 to 12 month period for a massive counter trend oversold rally. Only time will tell if or when the set up will be triggered.

- Goldman’s Late Call: Almost a worthless sell side call, however, Goldman still directs a lot of flows that can cause selling pressure. Today Goldman’s Chief Equity Strategist David Kostin who has been absolutely terrible over the last 12 months lowered his 2023 price target on the S&P 500 from 4,300 to 3,600 with a recession case of 3,150 on the index. While we won’t go into the specifics as it doesn’t warrant details, this type of sell side research does cause some selling panic.
- PMI: Today’s PMI for the U.S. was rock solid strong, which is very surprising after a weaker PMI in August. Good news is now bad as we cannot afford strong eco data in the face of a late to the party Fed that will be once again behind the curve. Today’s PMI came in at 51.8 vs. expected 51.0 and August 51.50. The S&P 500 feel about 30 handles after the news hit.
So how do we play this current set up?
As regular readers will know, we discussed in late August a retest of the lows was a 4 in 5 probability based upon our S&P 500 models. As we mentioned yesterday, based upon our research a move from -50 to the historical average of -70, would give the index a -6% leg lower to 3,580 on the S&P 500. This was based on yesterday’s close.
We saw a lot of volatility around the Fed move today for the following reasons. The initial 2 bullet points caused a rally, unfortunately the steepest inversion on the the yield curve since 1988 sent the indexes closing on the lows.
- We need to see both of these above start to trend in this direction in-order for the Fed to slow the pace of rate increases, noting “Higher for Longer” is still Powell’s mantra.
- Bullish: Fed lowered its economic growth expectations
2. Bullish: increased its unemployment rate expectation. 3. Neutral to bearish: Terminal rate jumped to 4.60%. However, whispers for a market crash were at 4.60% or greater, so in line with potential crash expectations from Goldman. As seen by Bloomberg’s dot plot the market got a little more fearful than the plots suggested. Anyway you cut it, we mentioned last week the market was looking at a terminal rate of only 4.25% and the velocity is ramping up significantly.
- VERY Bearish: This supersedes the first three bullets above as the yield curve based on the 2/10 spread just blew out its most bearish inversion since 1988 and 2000, which is now -.52%
S&P 500 Summary:
As we stated a few weeks ago 4 out of 5 times when our S&P 500 model experienced the red pattern below we saw a retest. We still believe there is a a high probability as we have been suggesting our S&P 500 model reverts back to -50 or less for a retest of the index lows. If the model does reach a -60, and then has 1 increase after it reaches -60, adding risk will likely be warranted.
Fixed Income:
On August 29th we stated, “For those of you who need fixed income exposure, AGG will be a very constructive long if it can trade to the $97.50 level”. Today we hit $97.86 and still think longer term $97.50 might be a constructive level to dip your toe.
NASDAQ & Growth trade
Our call still is in effect from September 6th when we stated, ” For those of you who did take advantage of our call to reduce growth/technology exposure when the NASDAQ (Futures) reached 13,650 (12% higher than today’s close), we are providing an update on allocating that capital. As we said shortly after Jackson Hole we did not believe 12,400 would hold on the NASDAQ.
- For those who removed 100% of your growth allocation in your models, you certainly have greater room to spread out your levels to buy. We would start nibbling at 11,450 (16% lower from 13,650) only if you already reduce exposure at 13,650. We would wait to be more aggressive at the ultimate level on the NASDAQ (futures) of 11,000 (19.41% lower from 13,650) . A lot of this will ultimately depend on both the dollar and the 10 year yield.
Dynamic Alpha Update:
Dynamic Alpha over the last week has held up relatively well vs the S&P 500. While we would have liked to be in a great percentage of cash, we are now roughly 20% cash as of the close today. However, many names continue to hold up very well like, CDNS, ON, K, LW, HSY, MCK, ENPH, HII, CAH, WM, BF, and NOC. I do expect more selling now raising some additional cash this week. Dynamic Alpha is now outperforming by an estimated 2% for September.
All Weather Models
If you have not reviewed the All Weather models yet, it is time. These models were designed specifically for periods of uncertainty like 2022. Read further here:
Friday, September 16th
That was some week. While Dynamic Alpha is almost 95% allocated we did outperformed the S&P 500 this past week by an estimated 2.00%. We do expect if equity markets do not firm up after this weeks increased volatility that Dynamic Alpha will start to de-risk on a stock by stock basis. Even though risks are to the downside of a potential retest of 3.660 on the S&P 500, many of our names remain very bullish. However, as we know all stocks will have a correlation of 1 if we do retest 3,660 or potentially lower. While we can’t predict a retest, we can see a scenario where Dynamic Alpha over the course of the next 5 to 10 trading days will start slowly selling our riskiest equities and raising potentially 10% to 23% cash.
Remember we said back on September 9th, that 4 in the last 5 times when our S&P 500 model experienced the same counter trend patterned, it failed and retested the -50. Stated here, “S&P 500 model had a counter trend rally from less than -50 that failed before 50, but greater than 30. There are 5 periods 2001, 2002, 2007, 2011, 2015 not including 2022. In all cases except 1 the model mean reverted back below -50 and rallied back higher. Only in 2011 did the model not fall back to -50. If we were to follow and believe the model’s outcome, then a retrace to a -50 is in the cards”.
If earning season is anything like what we saw with FedEx, this seems logical. The current reading is a -16.22.
While most sell side Wall Street research is mediocre there are a few goods ones to pay attention to. Deutsche Banks Matt Luzzetti has been better than most. He is out with a note today that the terminal rate need to get close to 5% to be consistent with the historic pattern to the nominal fed funds during a late cycle. If Matt were to be right for those of you who have not thought about a rebalance in your 60/40 of fixed income exposure, it maybe time.
For those of you who don’t follow the sectors that closely, here is a chart provided by Goldman showing what sectors are hit from least to worse during a recession.
Here is a good chart from Goldman and here is why you need to be careful getting too defensive in the heart of a recession. Forward EPS continue to decline well after the start of a recession however, P/E’s start stabilize and expand.
uesday, September 15th
Back on September 7th, we stated, “Below we highlighted all the times when the S&P 500 model had a counter trend rally from less than -50 that failed before 50, but greater than 30. There are 5 periods 2001, 2002, 2007, 2011, 2015 not including 2022. In all cases except 1 the model mean reverted back below -50 and rallied back higher. Only 2011 did the model not fall back to 2011. If we were to follow and believe the models out come would retrace to a -50 a retrace to 3,600 is in the cards”.
Today this set up is upon us. Tonight FedEx blew up and removed any forward guidance and I don’t believe this is company specific, the rapid rate cutes about to unless hell upon the S&P’s EPS.
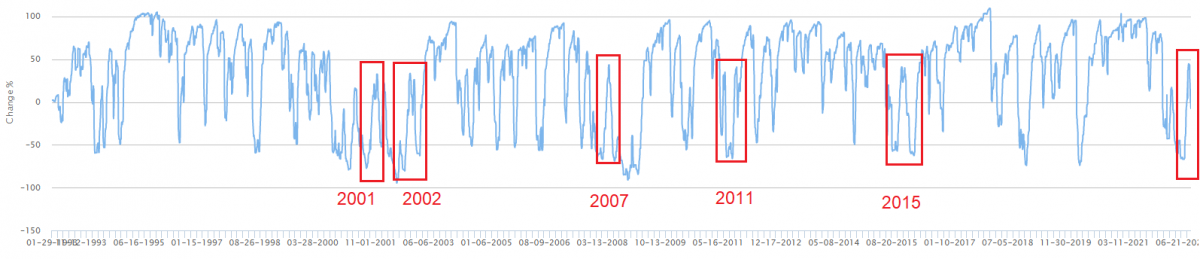
Tuesday, September 11th
You can throw the idea of a nice soft-landing out the window now. Today was a complete surprise as the consensus missed both core and headline inflation numbers. Everyone front ran what they believed to be a lighter CPI and the entire Bullard rally unwound. Now, the odds of a 75bps hike in Nov jumped to 60% and 47% for 100bps next week. So buying the dip right here is not going to work. The NASDAQ (FUTURES) will seemingly retest 11,500, before real buyers come into find some value within Tech.
So now what? We are heading into earnings season with a blackout period of corporate buy backs that will will not provide a backstop. Personally, I think the sooner we can retest the lows of the year the better to get the market pricing in cuts.
Monday, September 12th
Post-Market
No surprise today, the NASDAQ futures & S&P 500 hit and closed above our top end target of 12,800 and 4,090 we mentioned Friday. Financial conditions are now easing even more and according to Bloomberg the market is ramping up its rate cuts for 2023. Even the yield curve is narrowing and now only inverted .22bps. Powell is not going to love how the market has once again completely eased financial conditions after his Jackson Hole hawkish stance. Now with todays close the NASDAQ (futures) and S&P 500 could easy trade back to to 13,600 and 4,250 on the S&P 500 as those are the next gaps to fill.
Why we are rallying? Not based Financials!
- Dollar declined further today easing financial conditions.
- Yield curve steepened.
- Front running a weaker than expected CPI. I would say now, even a stronger CPI will be a positive as it will once again be called peak.
- Highest level of cash from institutional investors since 2006. Maybe ever (see below chart)
- Systematic Flows from CTAs de-risk already.
- The narrative has not changed, the ONLY thing that matters in this market is fund flows NOT fundamentals. There is no visibility on 2023 earnings as we mentioned on Friday so quantitative CTA’s and Systematic MACO are driving prices first and foremost lead by the futures market which is becoming increasingly less liquid.
The Inflation Trade on Multiples
- Friday we referenced Guggenheim’s chart (see below) that the S&P 500 historical multiple during periods of 5% to 6% inflation was 14.5X or in this case ($250 consensus X 14.50) 3,625. Its hard to except that $250 is reality for 2023, but we will find out soon enough in the quarters earnings.
- So why are we trading at 16.50%? Liquidity Liquidity and more Liquidity, the markets don’t believe the Fed will break inflation and until they significantly reduce the balance sheet coupled with a 4% Fed Fund rate. The market will most likely except higher inflation for longer until you get a significant Non Farm payroll loss of 500,000 to 1,000,000 losses.
Pre-Market
While we wanted to be sellers of the NASDAQ Futures at 12,800 and S&P 500 4,090. If looks like we might get a close above these today. The markets have been ramping as the dollar continues to weaken and market participants view CPI as a win win regardless of the print. Even if it is in-line the same narrative as the last three prints will play out that it is peak inflation.
The only think that matters is not fundamentals but the fund flows from CTA / systematic traders and this is why we keep trading this massive gap support and resistance levels. CTA’s delivered and now once again started to get long. Mean while long only money managers and mutual funds have the highest cash levels in the last decade based on Goldman Sachs work seen below. At this juncture, if the S&P 500 closes above 4,100, I can see a FOMO race back to the 200 days or close to 4,250 on the index.
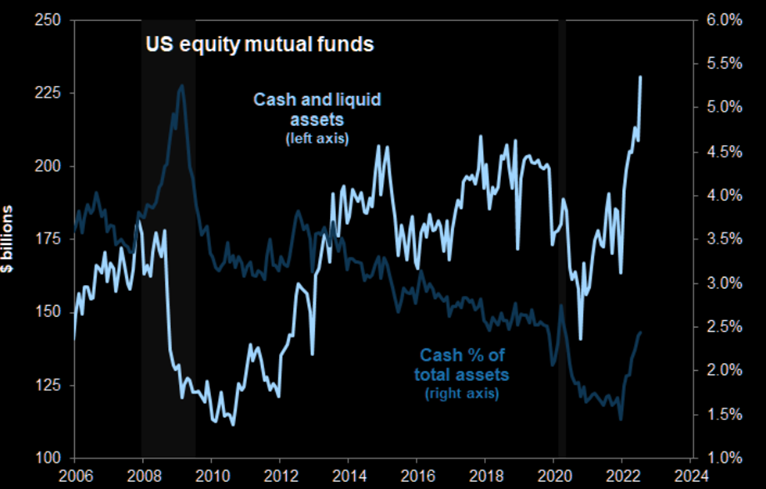
Friday, September 9th
We still believe for those of you who are tactical in nature and have cash to deploy the levels we outlined below are still plausible.
Why the strong rally off the recent lows? The dollar!
As we discussed on August 19th if the DXY (dollar) broke out above $108.67 tech and multinationals would see further downside pressure. The DXY did break out causing risk off in equities and reached $110.22 which did cause selling across all equities. However the reversal starting Thursday caused a bid in equities for a risk on environment as the Euro firmed up on its hawkish stance for another possible .75bps in Oct by the ECB. This coupled with another positive catalyst Thursday overnight in China and Japan sent the DXY back down to $108.95 as Macro sentiment turned positive.
Furthermore… Front Running CPI
Early Friday morning Fed president James Bullard (not a voting member) said that even if CPI next week came in light that .75bps was in the cards for Sept. This leads us to believe market participants are trying to front run a perceived weaker CPI print. Which ultimately in our opinion would be a pop in equities on the news and a sell. As we mentioned to our readers early on Tuesday we do want to reduce some growth / tech risk assets if the NASDAQ (futures) rallied to 12,580 and 12,800 respectively. We also said for very tactical advisors 4,030 and 4,090 are areas to reduce risk as well.
Technology de-leveraged hard
Below is a nice chart of the fund flows from BofA Global Research and as we can see investors dumped technology at a vicious rate. This offside positioning coupled with Bullard comments caused a strong short covering rally Friday.
Our S&P 500 model
Below we highlighted all the times when the S&P 500 model had a counter trend rally from less than -50 that failed before 50, but greater than 30. There are 5 periods 2001, 2002, 2007, 2011, 2015 not including 2022. In all cases except 1 the model mean reverted back below -50 and rallied back higher. Only in 2011 did the model not fall back to -50. If we were to follow and believe the model’s outcome, then a retrace to a -50 is in the cards.
No visibility
While we at Trowbridge are systematic quantitative investors and don’t invest on feelings and emotions, it’s easy to theorize on the Macro backdrop. The visibility into future earnings is one of the cloudiest we have seen since 2011. We have never seen such a wide earnings forecast range from the sell side in recent memory, ranging from $205 to $240 a share for the S&P 500 for 2023. So to discuss the true multiple on the S&P 500 is almost a worthless endeavor at this juncture.
Below is a great chart from Guggenheim showing where the S&P 500 PE multiples have traded during inflationary periods. Now we have no idea what EPS estimates Guggenheim is using here for 2023. However, at 4,100 on the S&P 500 and trading at 15.20X 2023 earnings they are using $269 a share which seems EXTREMALLY generous. If we were to use Goldman Sachs 2023 consensus of $250 that would be a 16.40 multiple which seems rather generous with core PCE siting 6.3% with GDP contracting. If we were to assign a $250 EPS for 2023 with a PCE of 5% to 6% that would give you a S&P 500 of 3,500.
Here is another great chart from Deutsche Bank showing an analog of all the boom bust cycles vs. today.
Dynamic Alpha and All Weather Models
Dynamic Alpha is 100% committed, although the portfolio is still tilted to a defensive stance which allowed for August’s outperformance of the S&P 500. However, if the S&P 500 does have a high beta low quality risk on a rally that continues we would expect Dynamic Alpha to lag. Furthermore, based upon review of the individual equities of Dynamic Alpha, there might be a few names that could be sold over the next month if they do not see further improvement in our underlying models.
As for the All Weather Models, the Growth and Moderate allocations have a higher than normal cash level relative to growth and technology which allowed for a significant out performance in August if you recall as seen below. However, we would expect if the NASDAQ futures did reach the upper target level of 12,800 the Growth and Moderate models will lag their benchmarks to a certain degree. We feel comfortable with their current positioning especially given the significant out performance year to date vs their respective bench markets.
Dynamic Alpha (DA)
DA -1.92%
S&P 500 -4.08%
Outperformance +2.16%
To research Dynamic Alpha go to Envestnet and search Trowbridge Capital Dynamic Alpha Managed Account (ACM-TCDA)
Past Performance is not indicative of future returns
All Weather Growth (AWG)
AWG -0.58%
S&P 500 -4.08%
Outperformance +3.49%
Past Performance is not indicative of future returns
All Weather Moderate (AWM)
AWM -0.97%
80/20 -4.04%
Outperformance +3.07%
Past Performance is not indicative of future returns. 80/20 is SPY/AGG
Wed, September 7th
- Today was nothing more of a small short term oversold bounce. The NASDAQ got a strong bid as Crude took out a big level at $85.80 and now is most likely going to test $77.30. This breakdown is NOT a Macro positive in the long run as the narrative soon will be demand destruction is upon us. This could give us a big in the NASDAQ (futures) to 12,580 and a little downward pressure in rates. For those of you who did not sell into our 13,650 level on the NASDAQ (futures) take advantage of selling into 12,580. As we mentioned yesterday, we believe 11,540 is in the cards and 11,000 would be the capitulation to lean more net long.
- The ultimate line in the sand to reduce all technology is 12,800. As for the S&P 500, we are a small seller at 4,030 and very aggressively reducing exposure at 4,098 which would be a blessing for the longs.
Pre – Open
Below we highlighted all the times when the S&P 500 model had a counter trend rally from less than -50 that failed before 50, but greater than 30. There are 5 periods 2001, 2002, 2007, 2011, 2015 not including 2022. In all cases except 1 the model mean reverted back below -50 and rallied back higher. Only 2011 did the model not fall back to 2011. If we were to follow and believe the models out come would retrace to a -50 a retrace to 3,600 is in the cards.
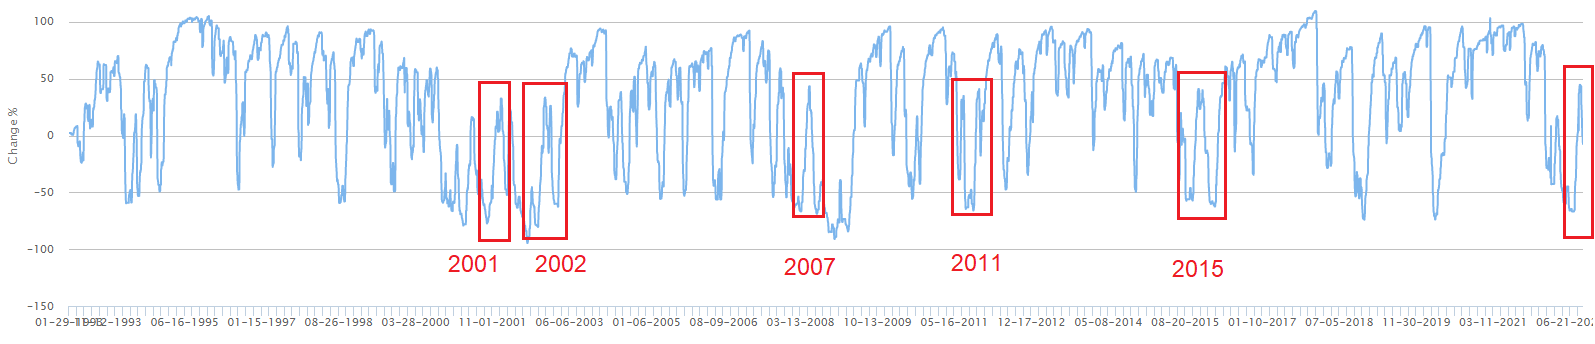
Tuesday, September 6th
For those of you who did take advantage of our call to reduce growth/technology exposure when the NASDAQ (Futures) reached 13,650 (12% higher than today’s close), we are providing an update on allocating that capital. As we said shortly after Jackson Hole we did not believe 12,400 would hold on the NASDAQ.
- For those who removed 100% of your growth allocation in your models, you certainly have greater room to spread out your levels to buy. We would start start nibbling at 11,450 & more aggressively 11,000 respectively on the NASDAQ (futures). A lot of this will ultimately depend on both the dollar and the 10 year yield.

- For those of you who can be extremally nimble and do not want to wait to buy a mutual fund based on closing prices, XLK is the play, otherwise stick to the model allocation we have provided most of you for the growth sleeve. The Technology Select Sector SPDR Fund (XLK) being market cap weighted makes it extremally difficult for any active manager to outperform XLK on the upside and even the downside. Over the last decade the drawdowns on XLK have been very good because the largest components are 50% weighted in the bedrocks of the S&P 500 like MSFT, GOOG APPLE. However, it is understandable that no advisor wants a large allocation to a sector technology ETF for aesthetic reasons. While we cannot forecast if XLK will reach its massive support level of $124.76, that is a level where the risk reward sets up nicely for a a medium term bounce. A lot will come down to the dollar and yields.

- As we discussed on August 19th if the DXY (dollar) broke out above $108.67 tech and multinational would see further downside pressure. Today the DXY closed at $110.22 and now $112 is now in the cards with a potential blow off top at $113. At $113 Gold could be a counter trend trade if the dollar reverses.

- The 10 year yield has a very large resistance level at 3.50%, which seems to be a high probability at this juncture. A close above this level will get you to 3.80%. 3.80% will set the stage for an aggressive overweight growth tilt while adding to core fixed income.

Friday 2nd
- Today we got some positive first signs that wage inflation is subsiding as average hourly wages came down in the latest jobs report. Secondly, the headline employment number did increase, arguing that Fed might have more to work with in terms of a less hawkish stance.
- Off of the jobs report the S&P 500 4,022 up 46 points, before reversing 90 points off the news that Gazprom will not be reopened as Putin is having some fun at Europe’s energy expense. I personally don’t see this a significant risk that the market is not already aware of. I believe this is more of an excuse to sell into a long weekend.
- Wake me up when we get to 11,500 on the NASDAQ futures, that might be worth adding to some tech at that point.
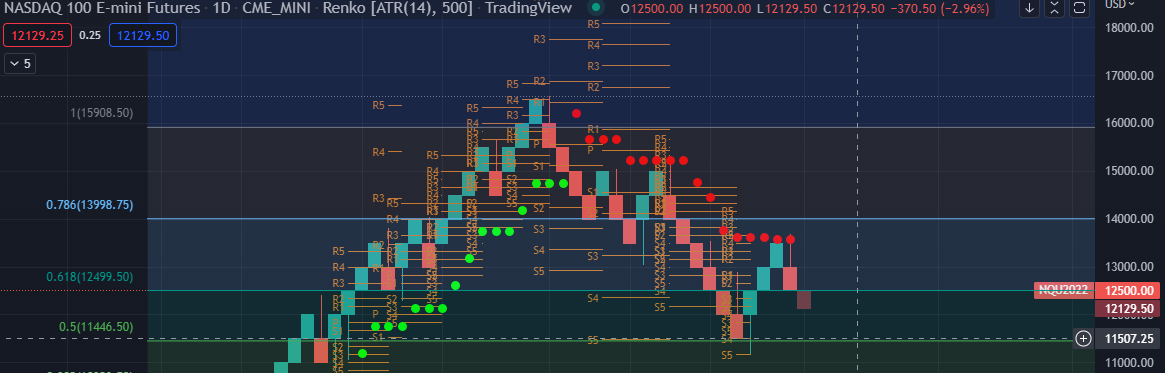
Thursday 1st
Wow that was a very interesting day but not unexpected.
- As we previously stated last Friday, we doubted the NASDQ futures would hold 12,400 and 12,000 was in the cards. Today we hit 12,017. Granted the NASDAQ was in hard sell mode over night off the back of the NVDA news the U.S. to block certain chips being bought in China, taking down all Semis. We still own ON as it is hands down the strongest name in the group. We still are not buyers of Growth / Tech yet.
- As for the S&P 500, we said we doubted 3,950 would hold. However the index did a nice job defending 3,903 for a 68 point bounce off the low. This might help the index consolidate within this region, although I still expect more weakness in the coming weeks.
- Bond Yields on the 2 year took out our level of 2.44% for a close at 2.51% and the 10 Year Yield is heading back to 3.40%. Again, their will be a good trade in bonds, but we are not yet there.
- There has been almost no trend in factors or sectors or groups and today you had Healthcare finally lead the way as the best performer followed by Utilities.
- The dollar strength is causing significant pressure on Gold, however, for those looking to add to your current allocation, we would be waiting for a blowoff top in the dollar to add Gold.
Wednesday 31st
No change in opinion.
- 12,000 NASDAQ futures is the next stop
- Doubt the S&P 500 will hold 3950.
- September will be rough as larger investors are going to reposition for the new narrative of higher for longer rates.
- There will be an opportunity to redeploy cash, however, we are certainly not there yes. There will be a time when the FED will once again Pivot once we are at lower levels. This will set up for another rip your face off rally.
- Remember, never be too bullish or bearish and be as systematic as possible based on the price and you will navigate the volatility without being whipsawed.
- For those of you who need fixed income exposure, AGG will be a very constructive long if it can trade to the $97.50 level.
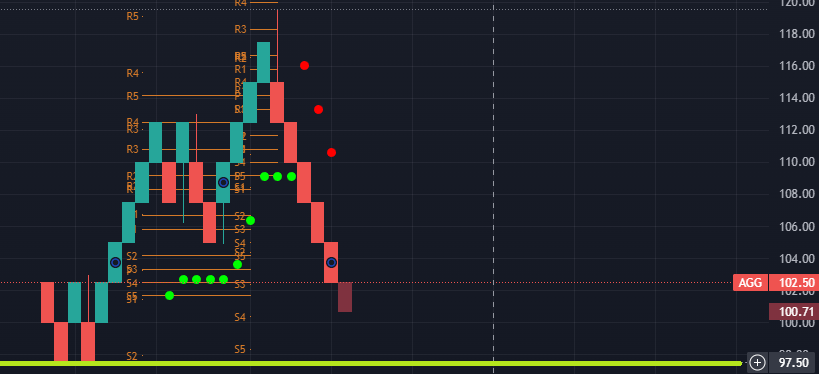
Tuesday 30th
As we mentioned on Friday, we were doubtful that 12,400 on the NASDAQ futures would hold and today it did not. For those of you who did reduce growth / tech exposure at our 13,650 level on the NASDAQ Futures we are still waiting to redeploy that capital at more favorable levels.
- There are no bids today as investors fear the Fed put is gone for now. Of course this will change at lower levels.
- Taiwan shot down another Chinese drone causing some risk off behavior in Global markets.
- Bond Yields are jumped on the 2 year yield to above our 2.44% level.
- NASDAQ (Futures) as we thought and mentioned below would not hold 12,400. Lows for the day were 12,247 with a close at 12,360. Its seems probable that 12,000 will not hold either at this juncture. However, all factors both growth / value / risk and quality did equally as bad today!
- S&P 500 (futures) hit a low of 3,964 today, as we discussed we were looking for 3,950. We are less concerned with the S&P 500 as this point, however, any risk off will cause all correlations to rise and all equities will sell off.
- Energy and Oil are underperforming today as Iraq vows not interruption in Exports during increased overnight tensions.
- JOLTs data today rose to 11.23 in July above expectations. This is showing strong labor demand, which is not exactly what the Fed want to see for slower wage inflation.
- Today under the hood was an interesting and more negative day than what was seen on the index level. All factors and sectors had a high degree of correlation and not even defensive equities were immune to the selloff.
In Summary
We are looking for potentially 12,000 (NASDAQ Futures) to determine if we will add back growth exposure.

Monday, August 29th
- As expected Energy outperformed nicely today, but did close well of its highs.
- We expect a defensive tilt to continue for the foreseeable future.
- S&P 500 held 4,000 never tested our 3,950.
- NASDAQ did test 12,401 and bounced. However, we still believe the probability of breaking this level is high come September.
- We still believe both the S&P 500 and NASDAQ are heading lower, especially as funds will be liquidating as they come to terms with Powells Friday Never Meant to Pivot. 12,000 NASDAQ futures is likely the next stop and the S&P 500 futures 3,900.
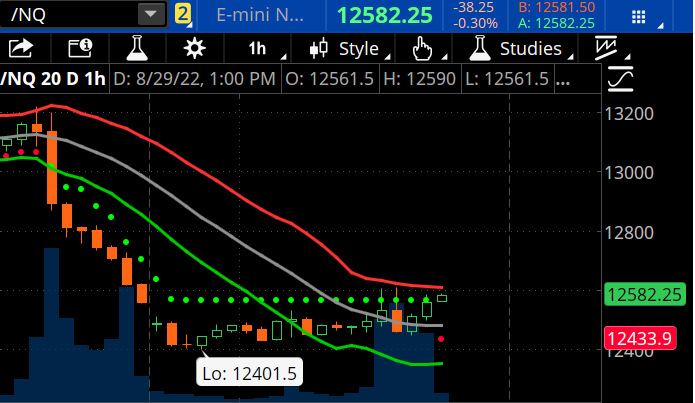
Friday, August 26th
For more active and tactical advisors we set forth a game plan over the last several weeks to reduce equity exposure (especially growth) once the NASDAQ Futures reached 13,650 (7.90%higher on a closing basis of 12,559) and 4,225 on the S&P 500 (4.04% higher on a closing basis of 4,043). We said 13,650 was a pivotal moment for the NASDAQ futures and a weekly close would signal a new bull market, which we did not believe was going to be the case.
For those of you who did reduce equity risk at the suggested levels above, we highlighted a game plan to redeploy that capital last Friday. Unfortunately, that game plan did not come to fruition. Our theory was that investors and hedge funds would have to de-risk going into Jackson Hole giving us an ample opportunity to reallocate at much lower levels, 12,400 on the NASDAQ (Futures) & 3,980 on the S&P 500. However, as we correctly pointed out, Powell needed to be Hawkish as the equity markets rallied 14% off their lows, making his job that much more difficult.
Friday’s Jackson Hole Sell-Off
For those strategists who thought today was a non-event, well obviously they didn’t get the hint from every hawkish Fed President in the last 2 weeks as markets were just too complacent. Well it turned out to be a potential short term game changer. In our belief, Powell never meant to be seen as pivoting. There was never a Powell pivot and his visible Hawkish agitation sent a clear message to those who took him as an Arthur Burns.
The set up into Jackson Hole in the preceding days seemed a logical risk off event. Every Fed official set the stage for a Hawkish tone, markets rallied 9% in July and market participants remained seemingly hedged and complacent Powell would not deviate from his script. However, this was certainly not the case.
As you have read by now, the big takeaways from Powell’s 8-minute Presser are:
- Higher for longer
- Expect more pain as the Fed deals with inflation
- The Fed cautions against loosening too soon
Powell eluded to his willingness of a softer labor market and economy to combat inflation which is the right move. However, a softer labor market is going to take several negative Non Farms Payroll prints, which we are not anywhere close! Furthermore, he cautioned against prematurely loosening too soon. We can assume this is what he needs to do to bring down expectation of rate cuts in 2023. Overall, the front end of the curve measured by the 2 year yield only moved .42% by the end of the day, but did come close to our target of 2.44% before closing at 2.38%.
What Now?
It is now highly probable that our support levels for the NASDAQ and S&P levels, as previously mentioned, will not hold. These levels are 12,400 (NASDAQ Futures) and 3,980 (S&P 500). As we have previously stated, we expect September to be a difficult month for equities as large institutional investors will now return from vacation and reassess Powell’s longer, higher and more pain rates scenario.
As Fed Hawkish stance is not back on the table expect commodities and energy to outperform until the narrative of demand destruction resurfaces.
All Weather Alternative Models Update
Reminder, for those of you who are using our All Weather Alternative Models seen here, we hope to have them available soon as a turnkey model. This means we will handle all of the rebalancing and trading as we do now with Dynamic Alpha.
Fed’s Favorite Inflation Indicator
Before we get too bearish we saw some good news on Friday with the PCE Deflator. The Fed’s favorite inflation indicator – PCE Deflator – was expected to slow in July data and it did with the headline dropping from +6.8% YoY to +6.3%YoY (cooler than the +6.4% YoY expected). Core PCE also slowed from +4.8% YoY to +4.6% YoY as seen in the Bloomberg data below.


Game Plan
We still would be looking at the same support to allocate cash but not the previous levels mentioned NASDQ (Futures) to hold 12,400 and 3,980. If these levels do not hold on a closing basis there are significant gaps that will cause significant pain for investors. We will discuss these levels as things develop further early next week.
ThursdayAugust 25th
Tomorrow we have the highly anticipated Jackson Hole presser. We thought we would have seen weaker price action in the markets into Fridays event and then a relief rally regardless of Powell’s Presser. However, this did not transpire and the NASDAQ Futures held our support level of 12,845 before closing at 13,143 today. As for the S&P 500 futures, we saw the index test 4,111, 33 points lower from our support level of 4,134.
So now what? Todays price action caught a strong bid around 4:30 am sending the S&P futures up 30 points after China infused $200 billion of new stimulus into their troubled economy. Markets got squared up and hedged and de-risk in anticipation for tomorrows meeting. Furthermore, we had several Fed Presidents try to talk down the equity markets recently, like today when James Bullard expressed higher and longer rates. Astonishing equities cared for all about 30 seconds before rallying, a rather bullish sign. The equity market surely have not got the memo about don’t ever fight the Fed, or does the market just believe Powell has no spine?
There is no clear path or direction at this juncture and for those hoping to see Powell actually be hawkish tomorrow, he has the opportunity as equities have risen, but wont. He wont because he made a severe policy error in the late Jackson Hole meeting and is too scared. It doesn’t really doesn’t matter if the Fed goes .50bps or .75bps in September at this point as the market believes rate cuts are coming in 2023 as seen by the Bloomberg chart below. The markets better pray the consensus is correct, or we are in for some downside pain IF this realization changes. PLEASE keep in mind we have yet to see QT come into play yet and Powell keeps pushing the full roll off down the road.
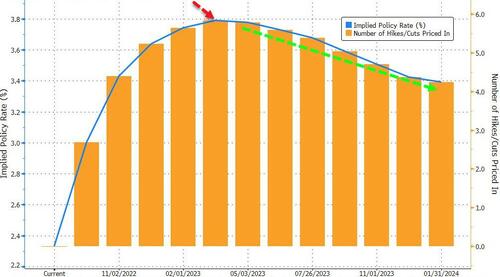
Monday August 22nd
It is almost like clockwork with these major gaps within the indexes. As we said last Friday, the narrative will change now that the short covering and CTA buying is over and the price action has changed. In reality nothing has really changed in the past week. Market pundits will now need to focus on the European / Dollar which we discussed on Friday as a major risk of breaking out and China’s progressively worse economic conditions for today. Additionally, many funds are trying to front run and de-risk going into Jackson Hole. The lower we go now into Friday the greater of a chance for a stronger rally Friday, almost regardless of what Powell says.
Here is what we said on Friday: A Fed hawkish stance next week at Jackson Hole seems logical as the markets have rallied significantly since Powell’s last presser, making his job harder to fight inflation as the wealth effect has increased. If this scenario plays out and the 2 year yield does reach that 2.44% level, 12,845 is in play for the NASDAQ Futures.
We also stated: Multinationals certainly do not want to see the dollar break out above $108.67 as it will start to cause currency risk and negatively impact earnings. Today the Dollar index did break out above this $108.67 level causing some additional havoc in equity markets.
While many of you are not tactically rebalancing your allocations nor should you really, sometimes it is warranted if there is a strong conviction.
- We have been telling advisory clients to de-risk from growth / technology for conservative to moderate investors if the NASDAQ (Futures) hit 13,650.
- There was ample time to reduce technology / growth exposure as the NASDAQ (Futures) hit 13,720 last week.
- Today the NASDAQ (futures) closed at 12,910 and reached a low of 12,874, just 29 points from our target we discussed on Friday.
- Additionally, we mentioned reducing some large cap equity exposure if the S&P 500 hit 4,225, the index closed at 4,143.
Game Plan
For those of you who did reduce a little risk at these above mentioned levels, let’s see what the next few days bring us investors prior to Jackson Hole. If the indexes move low enough (see levels below) prior to Powell’s presser it might warrant adding back to longs as the risk could be to an upside reversal off a dovish tone as Powell will not want to send prices lower into a weakening equity market.
NASDAQ Futures lower Levels this week: 12,400
S&P 500 Lower Levels this Week 3,980
Dynamic Alpha
Dynamic Alpha is currently positioned defensively with 14% cash. Certainly on days like today we had today more cash is better. However, our defensive stance allowed Dynamic Alpha to outperform the S&P 500 by roughly 1.20%.
August 19th
After a very nice rally the S&P 500 is once again not constructive for risk taking (net long) as the S&P 500 is sitting at 18 times forward earnings all while Q3 earnings are collectively decelerating and now coupled with a retest of 3.30% on the 2 year yield (see chart below). In our opinion, the 2 year yield might make an attempt at 3.44% the recent high going into Jackson Hole as the market bets on a slightly more hawkish tone. The 2 year yield’s bounce off of 2.88% was exceptionally strong, giving it power for a retest of the recent highs of 2.44%.
A Fed hawkish stance next week at Jackson Hole seems logical as the markets have rallied significantly since Powell’s last presser, making his job harder to fight inflation as the wealth effect has increased. If this scenario plays out and the 2 year yield does reach that 2.44% level, 12,845 is in play for the NASDAQ Futures. This theory rhymes with Richmond Fed President Barkin today saying, ““The Fed must curb inflation even if this causes a recession,”
If you weren’t paying attention to inflation lately, the largest European economy, Germany saw PPI came in at record highs at 5.3%.
2 Year-yield – click to enlarge

- This backdrop along with our models is one of the reasons we had a strong conviction to reduce growth exposure at 13,650 on the NASDAQ (futures) and to position portfolios more defensively. Our Dynamic Alpha strategy continues to be leaning towards a defensive tilt and underweight technology vs the S&P 500. Between Healthcare and Consumer Defensive the portfolio is weighted about 43%. However, we must say over the last 5 trading days, no sector or factor has seen a strong outlying trend that continued on a respective basis.
- Today’s Price Action: We wouldn’t read too much into today’s (Friday 8.19.2022) price action as it was a $2 billion option expiration day. However, the markets are now expensive on a fundamental basis especially as the 2 year yield looks to be retesting the highs. Additionally, CTA buying finally is drying up along with the short covering as we mentioned yesterday on our site.
- Short Covering: As seen below, according to JPMorgan, the short covering over the prior 3 weeks was a 3 sigma (3 standard deviation move) event that has now stopped in the last 2 days.

- Our NASDAQ Mean Reversion Model: By July 17th the sorts completely capitulated based on our model for the QQQs thus drawing in shorter term long investors who will certainly puke at the first sign of any weakness in our opinion. This is why we have been rather admitted to investors who are sensitive to downside volatility to reduce growth exposure at 1,3650 on the NASDAQ Futures.

- NASDAQ & S&P 500: For those Advisors who like to be a little more Tactical in their overall allocation during these periods of volatility, we have been suggesting the following:
- NASDAQ FUTURES: To reiterate, for conservative to moderate investors we wanted to reduce growth once the NASDAQ futures reached at 13,650. The index currently hit a low today at 13,230. For Growth investors we stated to wait to see if the index could close above 13,650 on a weekly basis. We stated 2 weeks ago 13,650 would be a game changer and a pivotal level to close above on a weekly basis.
- March 2022 Failure: Our recent call to reduce growth at 13,650 was based upon the same call we made back in March 2022 to reduce tech/growth after the NASDAQs bear market took the index back to its volatility stop at 15,000. We simply, did not beleive the NASDAQ on a weekly basis would close above its volatility stop as seen below in the charts referenced with the red dots on its first attempt. Ultimately, this would give the shorts more confidence to increase their short exposure.

-
- S&P 500: To reiterate, for conservative investors we wanted to reduce risk once the S&P 500 reached 4,225. The index currently is trading at 4,257. For Growth investors we are waiting to see if the index can close above 4,328.
- Our S&P 500 Model, we have been telling investors we thought we would get to at least a 50 reading on the counter trend rally if the model closes above 0 and recommending reducing risk up at this level. As of today, the model reached a 44.50 and by the reaction of the markets rejecting the 200 Day moving average the model might have a hard time reaching 50. Click image to enlarge

Bigger Picture – Markets are still expensive regardless of EPS
- S&P 500 to GDP Ratio or the Buffett Indicator: Because of the infusion of Money supply globally, not just here in the U.S., valuations measured to GDP are still at the highest level since 1929. Between monetary and fiscal stimulus globally there has been an infusion of roughly $80 trillion. Keep in mind, the Global markets have a capitalization of roughly $88 trillion as of 2021. So it’s certainly understandable why the S&P 500 vs GDP reached a ratio of .20 vs .14 in 1999 and .10 in 2007. Additionally, the S&P 500 is the largest and most liquid market in the world, in our opinion it of course would be the biggest beneficiary of the infusion of global central bank liquidity. Keep in mind only 1 central bank in the world is not currently reducing its balance sheet and that is China.
- S&P 500 & Private Companies to GDP: As seen in the second chart, the liquidity bubble was not just public markets and sent private company valuation through the roof.

August 18th
- Buying is slowly drying up on the CTA front in my opinion.
- Tomorrow we have a massive options expiration that will cause some volatility.
- Yesterdays Feds minutes were a non event, some strategist thought the FED was dovish while others thought they were hawkish. Its not relevant, what will be is Jackson hole next week.
- We still want to see the S&P 500 test 4,328 again to give everyone an opportunity to raise some cash before Jackson Hole and heading into September.
- It will take some time for this move to consolidate and rollover, but, in our opinion we will see the indexes roll over in September. How much is anyone’s guess.
- Again sell growth into the NASDAQ 13,650 level.
- Nothing else to really point out until tomorrow, which we will compile the weeks important data points.
- According the JPMorgan as seen below, the short covering over the prior 3 weeks was a 3 sigma event has now stopped in the last 2 days.
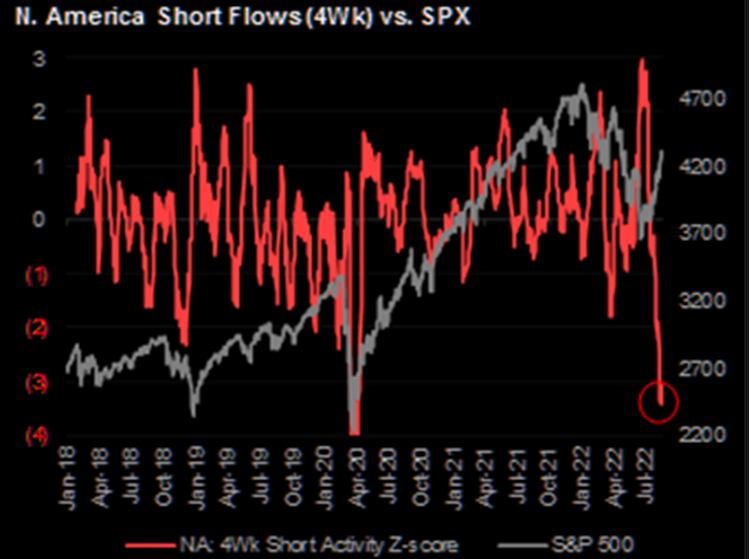
August 15th
The odds are increasing for a risk off Jackson Hole event which is the 25th to 27th! A continued rally into Jackson Hole in our opinion sets up nicely for sell the news.
Many market strategist have been weighting in if this recent run is just a bear market rally or the start of something new. While we believe the markets are very expensive on a forward basis, this doesn’t mean they cant continue higher. Lets not read too much into this than more than it is, we were oversold and system traders where extremally short that covered based on a Powell Pivot of Dovishness that flipped into CTAs buying. For long time readers, you will know what we think, it doesn’t matter what this is really. That is because the markets are being moved in either direction more than ever by systematic systems, most which are Trend following CTA’s that are pushing the futures around. Trowbridge is no different, we can see this in our own models. Goldman Sachs recently last week that CTAs had $5.6 billion to buy everyday this week (8.15.2022). Those who don’t realize what are driving markets can sit back with a fundamental view scathing their heads because it is almost irrelevant in this current Marco environment.
- NASDAQ Futures closed at 13,670, only 20 points from our 13,650 target. Most likely now the NASDAQ will continue to be bid up for the remainder of August as we mentioned on August 12th and could see 14,200. The NASDAQ was especially bid up today as we got terrible New York Manufacturing news this morning, which was the second largest decline ever!
- S&P 500: We said if you already reduced some exposure at 4,225, don’t sell anymore and let it ride as at least 4,228 and potentially 4,400 is in play. 4,400 would possibly to our blended S&P 500 model to a 50 to 65.
- I do believe reducing risk is going to be vital even if you have reduced some come September as I think the index will stall once everyone returns from vacation and a low liquidity environment.
August 12th
PLEASE NOTE: There was a data issue with the ratings, please disregard as tomorrow will be correct once we upload the files tonight.
Lets take a look at the S&P 500 and NASDAQ:
It’s always difficult to paint a broad brush on market calls as everyone has different investment objectives and is positioned differently. However, today we will try to provide a viewpoint based on different risk tolerances.
- Conservative to Moderate Investors: For more conservative to moderate advisor clients, we still want to reduce technology or growth related names once the NASDAQ FUTURES hit 13,650. The NASDAQ Futures closed on Friday at 13,570. We certainly do not want to sell 100%. Instead, we want to raise enough cash to reduce portfolio beta by .10 to .20 to dampen the downside volatility if the market reprices risk and allows investors to buy back at lower levels. (If you have not adjusted your portfolio based on risk reduction focused on beta, give us a call and we can help you). We also mentioned 4,225 on the S&P 500 being a place to raise some cash. Since we closed well above this level on a weekly (Friday) time period, we would now be holding steady for higher prices and not reduce risk at 4,270 (Friday’s close).
- Aggressive Investors: We would not be reducing Growth yet for aggressive investors until we can get confirmation of a failure on the NASDAQ Futures at 13,650. If the NASDAQ Futures do get a weekly close above this level, there is the potential that the index could test 14,200.
- NASDAQ Futures (NOT Cash): Do you remember when we said a week ago that the 13,600 level on the NASDAQ would be a pivotal inflection point? Well, we are almost there and we are moving that target slightly up to 13,650, and a close above here is going to bring in a lot of buying. This could be the final leg of this current rally to 14,200. So, it will be vital to keep a close eye on this development.

- Our S&P 500 Model: We have been telling readers since our S&P 500 model bottomed out at -66 on July 17th and then preceded to have its first increase that these are powerful counter trend rallies and that a move back to zero (0) was a high probability. Furthermore, we said a +15.00 reading is where the S&P typically starts to lose its bullish trajectory if this is not a full V-shape recovery, which on average reaches a +65 reading. We are now sitting at a +.37.
- As seen in the chart below, only 5 out of 13 times did the model fail in this 37 area, while the average V-shape counter trend rally stalled at 60.
- 2001, 2002, 2008, 2011 and 2015 were thee years when the model did not make it back to +60 from less than -60.
- If the model doesn’t start slowing down on its bullish accent it could take the model close to the mentioned +50/65 level, sending the S&P 500 to ultimately 4,400 before any significant retracement. While we don’t use or put any significant credence into the 200 day moving average as a metric, many mutual funds managers and retail investors will be watching 4,325 on the S&P 500 this coming week.


Wednesday Post close August 10th
Was today the end of QT!!! We still are sitting at 8.5% headline CPI with 8.2% projected for August print. Price is truth and this is now more than just a bear market rally and short covering. It is maybe the most hated rally I have ever seen since 1998, not even March 2020 and 2009 come close. The S&P 500 closed 12 points from our upper target of 4,225. For those investors who are overweight equities this is now a level to reduce risk. Although, be aware, the S&P 500 model looks to be heading to the 35 measurement we have discussed. This would take the index to roughly 4,300. As for growth stocks, the NASDAQ (Futures) closed at 13,370, 230 points from our target of 13,600. We would still reduce risk at 13,600 if you are over weight growth stocks, especially semiconductors.
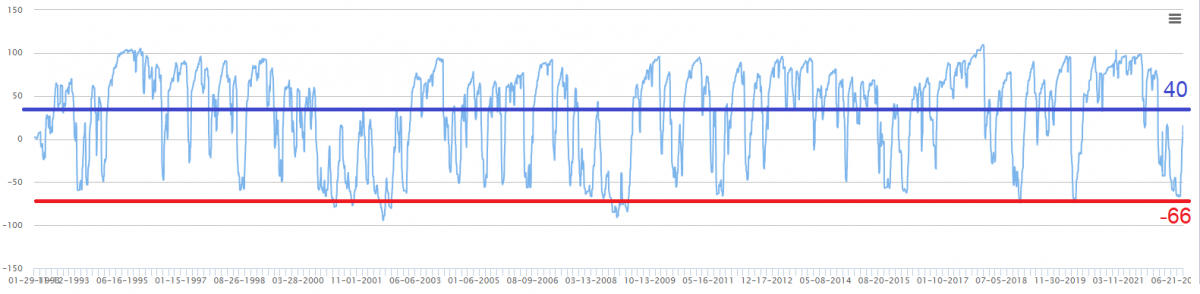
While I am most likely reading too much into this, the bond market did not buy into todays rally as much as you would have been lead to believe as equities did. Initially, the yield curve inverted (bull steepening) to -.38bps, however closed at -.44bps indicating to me the yield curve and bonds inverted off the lows sensing todays move was a little overzealous.
Lastly, we had Fed officials trying to talk down the markets as these rallies are making their job that much harder. Unfortunately, the markets have spoken and don’t care what these Fed Offices are saying as they have lost credibility.
Fed Evans who is a non voter so who cares said: “I expect that we will be increasing rates the rest of this year and into next year to make sure inflation gets back to our 2% objective”, Chicago Fed President Charles Evans says.
While the inflation report for July showed improvement relative to the prior two months, inflation remains “unacceptably high,” Evans says in discussion hosted by Drake University in Des Moines, Iowa
FED: Kashkari (2023 voter) stated he is happier to see inflation surprised to the downside, but the Fed is “far far far” away from declaring victory on inflation, and Kashkari added the latest data does not change his rate hike path and expects rates at 3.9% by year-end and 4.4% by end of next year. On inflation, he reiterated the Fed is united about its commitment to get inflation down to 2%, and noted the idea of cutting rates early next year is not realistic.
Wednesday Premarket August 10th
- As we stated in our weekend note, “In summary, a .10bps to .20bps decline in the headline CPI could get a rally to our levels of 4,225 and 13,600 (depending on today’s close which would be an opportunity to de-risk portfolios”.
- Furthermore, we said, “We would expect an initial relief rally with any small decline regardless if it is core or headline. However, unlike the last three prints, we could see a sell-the-news event this time around as it is very expected.”
- With the above being said, today’s close will be vital… a close at the highs will potentially set up the remainder of August to be very constructive. The NASDAQ Futures have currently (as of this email) another 270 points to get to our target of 13,600 to reduce some growth exposure if investors are overweight. As for the S&P 500, the index is trading 30 points away from the 4,225 target.
- On a positive note that could keep a bid under the market is the inversion of the 2/10 spread of 10bps to -39 from -.485. This should help relax stress within the financial markets to a certain degree, unless we start to see the front end rally today.
- Real average weekly earnings continued to decline and shelter inflation started to crack.
- Rate hike odds are collapsing, so we are back to .50bps for September from .70bps. Many strategists are saying 1 month is not a trend to get Powell to pivot, I say Powell is a slave to the markets and he will do what he needs to do to prop up equities.
UPDATE Dynamic Alpha
Dynamic Alpha is conservatively positioned against the S&P 500 with a portfolio beta of .78. If the S&P 500 and NASDAQ do break out above the 13,600 and 4,225 levels, we would expect Dynamic Alpha to lag the market. However, the portfolio should outperform on the downside if this 1 month decline in inflation is truly not a longer term trend. We believe Dynamic Alphas defensive tilt in this Macro backdrop of uncertainty is well positioned.
Please don’t hesitate to call or respond to this email if you have any questions. 917.653.3153
Post-Market Close August 8th
- We will discuss tomorrow CPI, however, our opinion is every one knows many input costs in CPI have come down significantly and the markets already priced this in for the last several weeks. As seen in the New York Fed Survey of Consumer Expectations as seen below.

- Gas and Food prices have dropped like a rock, however Medical Care, Education, Rents have not budged.

- In summary a .10bps to .20bps decline in the headline CPI could get a rally to our levels of 4,225 and 13,600 which would be an opportunity to de-risk portfolios. The S&P 500 today hit a high of 4,188 and the NASDAQ futures hit 13,400.
- No opinion on Semis today as NVDA lowered guidance of weaker gaming demand, but we believe a lot of this was baked into the price already. However, this did cause the NASDAQ to reverse off its highs.
- Lastly, today the 2/10 spread closed at -.457bps, we are not only .02bps shy of hitting the 2001 peak inversion. This is of concern to us. However, remember, these blow off reversals take several months to see the full negative impact.
Educational Post
For those who want to allocate capital for a potential V shape bottom, below is a good signal to apply. The % allocation will be up to you, but its a good guide.
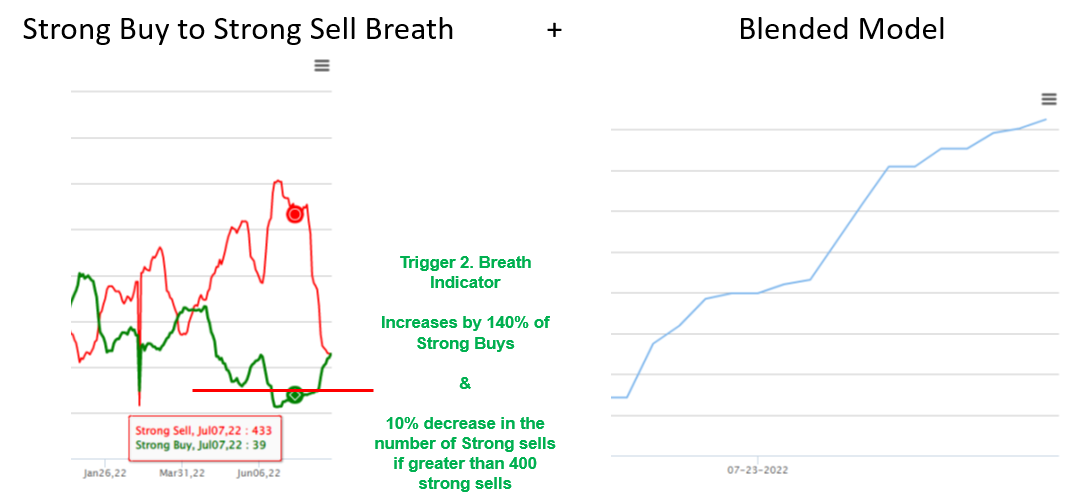
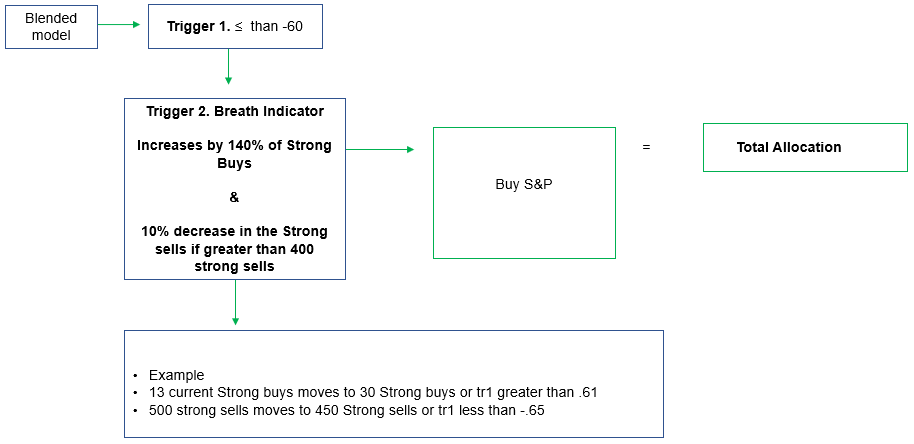
Post-Market Close August 5th
The soft landing thesis just got that much more difficult as the Powell Pivot is now in trouble after todays data. As we wrote in the pre-market a hot Non Farm Payroll and an increase in wage inflation (see below) would cause a selloff in the recent growth trade. As one would expect, this helped the value trade coupled with energy and financials today to rally. Does this mean it’s the end of the Growth rally, not necessarily. However, it does lead us to believe CPI won’t decline enough as consensus believes in the next print to keep the Powell Pivot alive. The market is now suggesting a 80% chance that the Fed will move .75bps in September from 30%.
A Binary Event
CPI is out this Wednesday and the market is looking for a potential .10 to .20bps decline in the headline number. While energy and some food costs have declined since July, if the headline number does not decline by at least .10 to around 9% and holds firm at 9.10%, technology is going to come under significant pressure and value stocks will get a significant bid. Conversely, if CPI does tick down .20bps to 8.90%, we believe a significant PEAK inflation rally will take the NASDAQ up to that 13,600 level. Thus once again rate expectation for September will decline back to .50bps.
More Importantly
More importantly than anything else we are watching the 2/10 inverted spread. As you know from our previous emails, it seemed this time around the spread was going to test -.48% last seen in 2001 and prior in 1998. Nothing good happened in the preceding months after the inverted spread had a blow off top. Even after a strong number the spread inverted an additional .059bps to -.41. This is possibly saying the bond market believes the Fed is going to have to push harder to slow down economic growth as the labor market is a beast.

How do we prepare for this? If investors are under weight value or have no allocation this certainly is one possible allocation for a reversion back into the value trade from growth. However, this might be just too short term tactical for many. We would expect Gold to now come under some pressure as todays job number was bullish for the dollar, however, its not worth reducing Gold exposure at this juncture if long. As for Dynamic Alpha, the strategy has very little exposure to growth and heavily tilted towards defensive stocks and some value. Today’s number was positive for energy. However, unlike the setup back in December/January, demand destruction with crude oil is in play because of the potential for a hard landing growing based on the 2/10 spread and is just not an area we want to be overweight yet.The S&P 500 has made tremendous progress and we still would be reducing risk at the levels we have discussed several times. One of my favorite proprietary metrics for the S&P 500 expansion is our Strong Buy to Strong Sell Ratio. These are our proprietary ratings for each stock. Back on June 21st there were 507 stocks within our universe that we considered strong sells vs 15 Strong Buys. Today we have 129 strong sells vs 120 strong buys. Historically, extreme readings in either direction with a rapid rate of change is a great set up for any reversion to the mean. Additionally, it is very bullish to see the green line of strong buys cross above the red strong sells.

Our S&P 500 modelOur S&P 500 model is now positive coming in at 0.28, which should not come to a surprise to readers. The moment of truth is approaching for the S&P 500 sooner than later. We have been raying the model could reach 15 before reversing.

U.S. Equity Positioning
While its impossible to know if this recent rally is just a bear market rally or potentially a breakout above 4,250 remains to be seen. However, our models above are not showing signs of slowing down yet in terms of positive price trends and momentum and rarely fail on the S&P 500 here. So far however, a large amount of this move has come from systematic traders (quants) covering shorts and assume hedge funds as well.
This chart provided by JPMorgan illustrates that every day for the past 2 weeks that the short covering was at extremes. This has been the largest de-grossing of shorts since March 2020. However, unlike the clear catalyst that sparked the recovery rally in 2020 that was supported by massive fiscal and monetary policy of around $6 trillion dollars, this time does not have one.

 Source Feberalreserve.gov
75bps is back on the table for September and its hard to argue CPI will come in much lighter now as a whopping NFP number hit this morning. WOW Almost a double in Nonfarm (NFP) payrolls, consensus was looking for 258k jobs vs actual 528k. The Fed will not like this thus Tech will not either as rates will move higher. What a dichotomy weakening negative GDP with such a strong jobs market. To keep tech bid the market needed a weaker NFP today.
Furthermore, we got a hot wage number that also will keep yield bid as well.
- US July Average Hourly Earnings Rise 5.2%, smashing expectations of 4.9%
- US July Average Hourly Earnings Rise 0.5% M/M; also beating estimates of 0.3%
- US July Private Payrolls Increase 471,000; Est. 230k
- US July Average Workweek at 34.6 Hours; Est 34.5
- US Manufacturing Payrolls Rise 30,000 in July
The most important things we are looking at as of Wednesday 3rd 2022:
- Price has changed, NOT the fundamentals or the economic backdrop. Price is a factor and more important than ever as more capital is being deployed within the quantitative and systematic investment space. These investors purely use price (Trend, Momentum, Mean Reversion and Statics) in their models and not fundamentals. The bottom-line is, we can all feel better with this rally, but the Powell Pivot was more of a reaction to extreme positioning and market participants will all follow each other like sheep.
- Our S&P Model: As we stated:
- Our S&P 500 blended model was the 5th most oversold since 1998
- Rarely does the S&P 500 fail when the model is below a -60 followed by an increase. Only 2 times has this occurred out of 18.
- We said a consecutive increase from below -60 could potentially take the reading to at least a 0 reading.
- Lastly, we said a +15.00 is where the S&P typically starts to lose its bullish trajectory if this is not a full V shape recovery which on average reaches a +65 reading. Click Image to enlarge.

- Our Upper range S&P Target: We pointed out 4 weeks ago the narrative of a Fed pivot was building as the most early cycle trade of semis broke out. Regardless if this Powell Pivot is nonsense, the bond market bought in and our upper price target of 4,200 on the S&P 500 would be an opportunity to de-risk. However, 4,200 is not an area we look to sell growth, that would be around our upper NASDAQ (futures) target of 13,550/13600. As we mentioned previously a weekly close above 13,600 is a pivot move in this cycle that we don’t believe is in the cards.
- The Reversion: We can certainly see a blowoff short term top at 4,225 as shorts panic as the index moves above 4,200. If 4,225 was achieved on an intra-day basis where the the index was up 50 to 70 handles, a key reversal will be in play. This would ultimately cause a retracement to 4,110.
- Yield & Spreads: PEAK INVERSION of the 2/10 Treasury spread will be the ultimate tell. As we can reference from the chart below once we experience a blow off top in the 2/10 yield curve spread inversion, the S&P 500 corrects within the follow months.
- Both 1989 and 2001 yield curve spread inversions peaked at a -49% on the 2/10 spread and within 4 months the S&P 500 was down on average -13.50%. 2007 did not invert as much, only -.17%, although a similar retracement in the S&P 500 occurred around -15%.
- It certainly seems like the 2/10 spread has the likelihood of inverting similarly to 1989 and 2001 at -.49% before peaking in this cycle and causing the markets to panic as economic contraction will not be avoid for a soft landing. Maybe this time will be different as there are only 4 data points of extreme inversion of the 2/10- spreads since 1989, which is not a large sample size for it to be extremally robust.
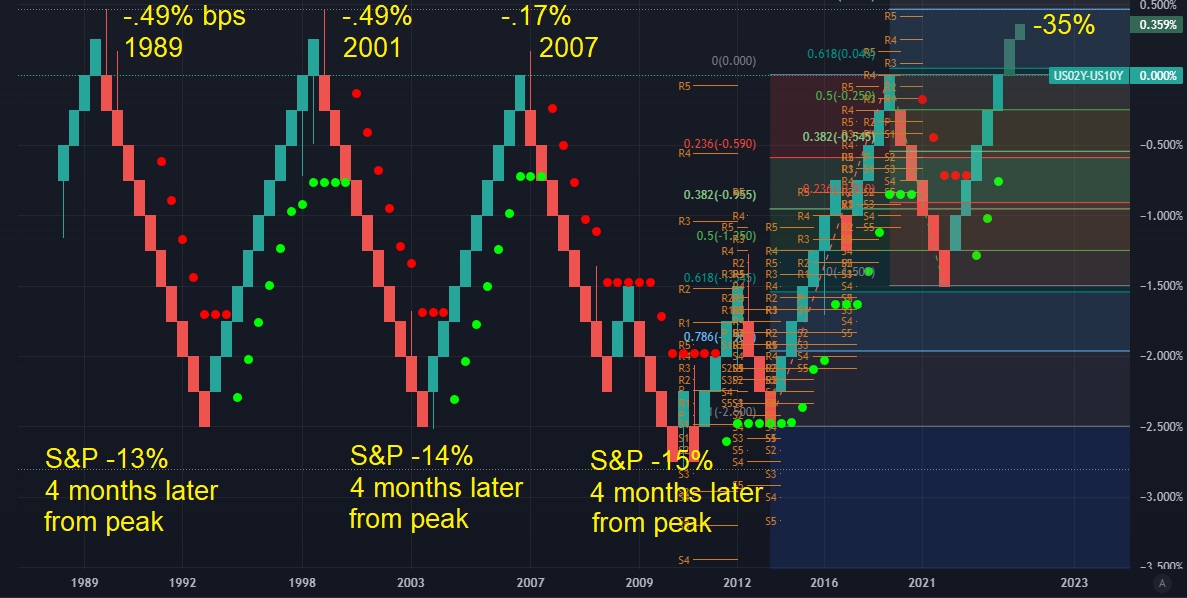
Monday 2nd
- Here comes the change of the narrative as we suggested, the Powell Pivot is premature.
- I am sure everyone is watching the blended S&P 500 model as it now sits at -4.68 a move from -66. As we mentioned, we believed a 0 reading would be reached and possibly 15 before failure.
- We suggested on Friday the 29th to reduce fixed income IF the 10 year yield hit 2.49%, we were slightly shy at the yield hit 2.53%. Keep an eye on yields and any another retest within the 2.49% reduce fixed income within medium duration bond exposure.
- A lot of jaw boning today with the Fed as they clearly cant have the market go up to much more on the back of Powell’s dovish pivot, something we highlighted last week. Here are the Fed speakers hawkish tone today that sent stocks lower.
- SF Fed’s Mary Daly jawboned the doves back by stating that The Fed is “nowhere near done” on fighting inflation, adding that “we have made a good start, and I feel really pleased with where we’ve gotten to by this point,” but inflation is “far too high.”
- Chicago Fed President Charles Evans said he is hopeful that reaching 3.5% by the end of the year is “still reasonable.”
- Cleveland Fed’s Loretta Mester said she saw “no signs of a recession” offering no dovish pivot signal by noting that “we have to get inflation under control.”
- TS Lombard writes: “…real rates remain deeply negative and will have to increase sharply before monetary policy is appropriate. Some of that increase should result from slowing inflation, but the rest will come from further hikes. The Fed will keep pushing rates higher until it creates sufficient slack in the labor market to bring inflation close to its target.”
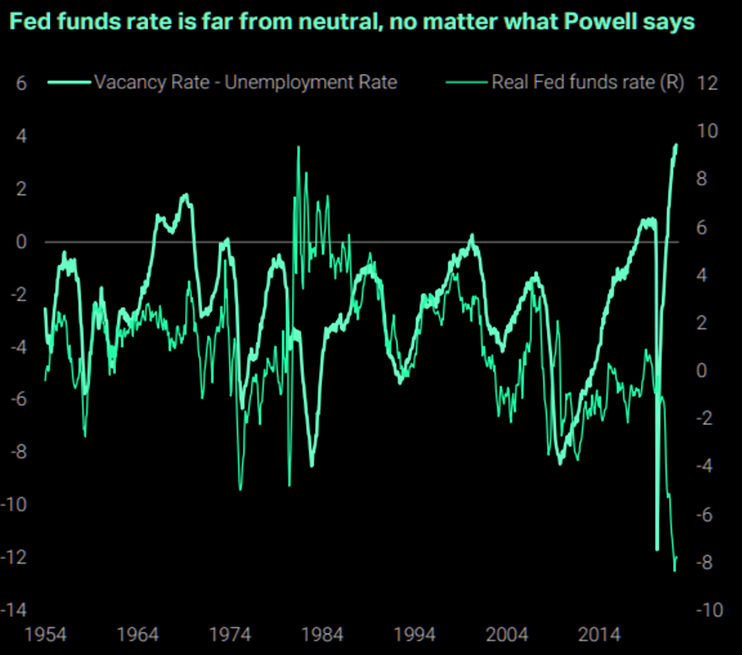
Monday 1st
Not too much happening today, here are the most important things we are looking at.
- Crude oil down 4.89% as China’s PMI significantly came in lower than expected.
- 2/10 yield spreads closed at a -.303%, just about the lowest inversion since 2001, not a good sign for the overall economy, but this will keep Growth slightly more bid as investors seek growth in a slowing economic backdrop. This was off the back of the Atlanta Fed slashing Q3 GDP growth. Of course this will all change IF and When CPI doesn’t prove to be declining as much as the market believed and the Powell Pivot comes into question.
- The most hated rally by hedge funds still has more to go as there is no clear catalyst just yet to send prices lower. Momentum will need to stall before weak longs hit the exit button.
- Lastly, Semis outperformed today as we believe Pelosi’s trip to Taiwan sparks fears of China needing to prove their position and thus could cause supply disruption in the Semi space. This in our opinion is sell the news.
- Dynamic Alpha is adding ACC (REIT), AMCR (Packaging) and DLTR (discount Stores)
Friday 29th
What a week! This business never gets boring. For those who read our work, this market is trading like clock work.
- UPDATED July 30th: We said back on July 15th that our S&P 500 model (seen below – click to enlarge) coming off a -66 to -48 must continue or the S&P 500 could stall. Also, we stated once above a -48 reading a reversion to at least a 0 reading was highly probable. As of Thursday’s close, the reading was a -18 and as of Friday’s close we are sitting around -09. Our assumption is that unless this is a typical V-shape recovery, the model will stall at around +.15, which will take the index to around 4200 possibly 4225. This move in the model is very powerful and it rarely fails now, +.15 is actually the low end and as in seen in the data would be rare to fail there. If you look at the data on the Market Internals > S&P 500 blende model click back to 1993, there is actually strong data that suggests the model the majority of the time reaches .30 or around 4,287. We have been discussing the upper range to reduce being 4,200 because this is where the index broken down sigficant.

- We have repeatedly said 4,170,4,200 is where we want to reduce equity exposure specifically in areas that have moved the most off the bottom such as Semi’s, higher beta tech, less profitable tech, Smaller Capitalization companies, Consumer Discretionary. While we don’t know if this is a bear market rally or not until the cycle is complete, our first objective is to mitigate downside volatility.
- IMPORTANT: There is an old saying on Wall street, “The consensus doesn’t have yachts”. Thus, the consensus is now in full effect that the Fed has pivoted and cuts are under way for 2023. This herd mentality causes room for concern.
- Friday’s University of Michigan Inflation expectations rose intra month.
- Friday’s Chicago PMI showed prices paid jumped.
- Friday’s PCE Deflator increased significantly.
- With these recent inflation numbers, we think the “Inflation is Over Rally” could be an opportunity to de-risk fixed income exposure. We are looking at 2.47% as a level on the 10 Year Yield to reduce some fixed income exposure. If you are not sure of the correct mixture to reduce, feel free to call us to discuss or reply to this email. However, the risk with reducing fixed income is if the Labor Market does turn recessionary and claims move up bond will certainly catch a massive bid and the 10 Year Yield will see 2% once again. Of course, the labor market still remains tight now.

Dynamic Alpha continues to be positioned defensively as now 20% of the portfolio is in cash with a portfolio beta of only .60. The portfolio has been allocating over the past 10 days to lower beta defensive stocks with an overweight tilt in Health Care. As we mentioned, these names will have very limited upside capture in a V-shape recovery, however, we are pleased with the allocation as we do feel 4,200 on the S&P 500 will draw in sellers.
What Dynamic Alpha Is Buying
On Monday, August 1st, we are buying:
WAT: Healthcare Diagnostics
BR – Info tech in financial reporting analytical
NNN – REIT
Thursday 28th
- The PIVOT: Markets rallied on the back of yesterdays Fed pivot coupled with a weaker than expected GDP print this morning. Today’s rally should not have come as a surprise after Powell said he was data dependent and we got some bad data! For weeks the market was pricing in this Pivot. We have been steadfast with our assessment of this pivot with a strong early cycle regime change that started back on July 5th with the large variance signal between Semi’s vs. Utilities.
- Less Inverted: Further support to show evidence of a Fed Pivot was a steepening of the 2/10 spread of .10bps today as well as the 10 year yield hit its lowest level since April.
- Bad data: The first estimate of Q2 GDP came in at -.93%, well below the .50 consensus. This initially sent the futures down, before traders realized this is exactly what the market wanted for a Fed pivot in September.
- After hours the S&P 500 hit 4,110 and 12,948 for the NASDAQ futures off the back of better than feared Apple and Amazon earnings.
- As mentioned over the last several weeks, we felt 4,150/70 and 13,000 will be areas to reduce risk.
- The line in the sand and a defining moment for the index’s will be 4,240 on the S&P 500 and 13,600 on NASDAQ (Futures). These levels are game changers and will flip the trend and gamma dynamics from a bear market rally to something much more sustainable. We are not in the camp that these levels can be taken out or even reached, however, it would be a significant opportunity to de-risk if the indexes could reach these levels.
- Machines are not long: This continued economic contraction will continue to support equities as we have been suggesting for the last 3 to 4 weeks. Additionally, at least for now, large cap companies with the exception of “WMT-Walmart” have been able to defend their margins this quarter. We will hit a level technically where the market will change the current narrative of bad news is good to bad news is bad. However, we need more buyers to be drawn into the market before a reversal can happen. This is just the dynamic of a bottoming process where investors not only fear missing out they believe the narrative has changed. As seen below, systematic quants, CTAs, Volatility targeting and Risk parity funds are not long at this juncture and about to flip to buying.
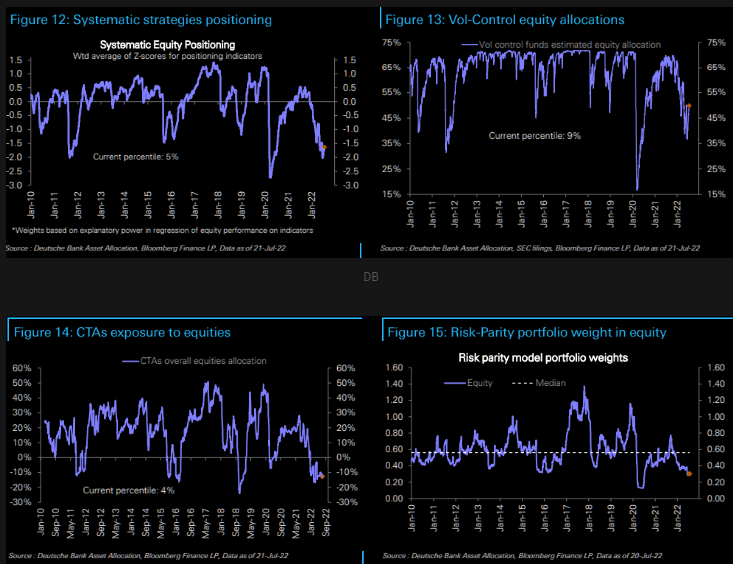
Tuesday 27th
POWELL as expected was dovish. His message…
- “Data dependent = lets not discuss a .75bps increase in September,
- “Rates haven’t worked through the system yet” = maybe this will be enough for further economic contraction.
- For our readers, we have repetitively said Powell doesn’t have the guts to be Hawkish”
- What is amazing is the market trade off his comments to the extent they do, as he and the FED is as clueless as the rest of the market participants when it comes to forecasting. We are all data driven!
- The market jumped especially in growth as he said it will be appropriate to slow the increases at some point. This is rather obvious as the market has been pricing this in for three weeks. However, positioning as we have pointed out is skewed to the downside causing a relief rally.
- I believe it was dangerous for Powell to be this dovish as driving market prices higher will not help his fight combating inflation.
So where are we and how do we get positioned?
- First and foremost our S&P 500 model seen below is a -36 coming off a -66 and as we have been discussing rarely do we fail on the index level at this juncture, 0 seems a local reversion to the mean.
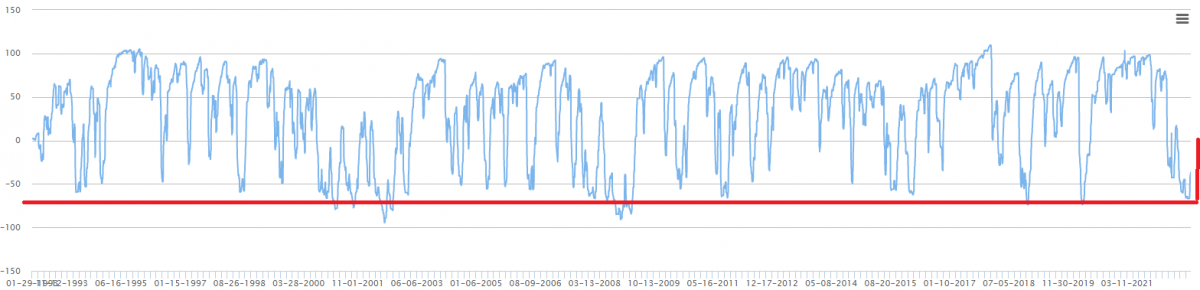
- The macro is taking a back seat in the last week as companies are not kitchen sinking their guidance unless you are a retailer selling into the low end. So margins seem to be holding up ok, even though top and bottom-lines are coming in slightly lower.
- Markets seemed to like the deep inversion of the 2/10 spread, which hit a new low of -.30 today as if the markets seemingly wanted a crash in economic actively in order to get rate cuts sooner. However, after the 2/10 spread reached -.30, the spread closed up -.20.
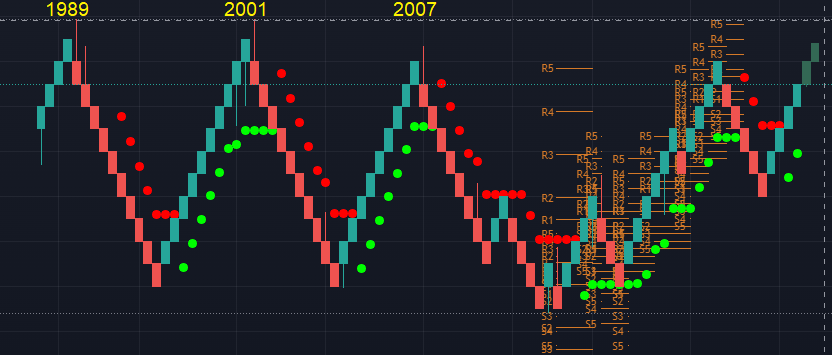
- No one is long equities!!! This could be the most important factor. FOMO is now going to steam roll everyone. They will draw them into the market at which point will most likely have the market rollover at higher levels.
- Summary: The pain trade seems higher and dips for now will be bought. We are still sellers of equities IF and when the S&P futures can trade into the 4,150/70 level. We also remain sellers at 13,000 on the NASDAQ futures of growth. While, we do not believe that the ultimate line in the sand for the NASDAQ futures of 13,600 will be breached this summer, we would keep exposure to growth in case we do.
- Lastly, Dynamic Alpha is getting long two software companies CDNS & SNPS.
Tuesday 26th
The MACRO is what is important now!
A lot of earnings after the close MSFT, V, CMG GOOG and TXN. Overall the futures are rallying off the earnings reports, NASDAQ is up 180 handles. MSFT, V and GOOG are the most important. MSFT is stable as a rock as fears of corporate cap ex spending is not yet being seen by management. However, the MACRO backdrop is what is going to drive the markets next move. All of these earnings were in my opinion non-events, they are all essentially trading slightly up to flat, as they were not as bad as feared. There is no doubt these companies are seeing a slow down with maybe the exception of V.
So why is the S&P 500 still trading just shy of 4,000, which seems rich if we even enter a lite recession? As we have said over and over, we believe over the last several weeks the market has been more than gracious in its pricing in of a future Fed policy adjustment of rate cuts in 2023 (as seen below by the Goldman market participants expectations of rate cut chart). This is why growth has rallied significantly as we have been discussing. However, what if consensus is terribly wrong about this forecast. The only way consensus is wrong is if consensus is that off regarding CPI seeing its peak and declining to roughly 3.5% by December. The so called sticky inflation “wage and rents” will certainly be difficult to get out of the system, but the market is seeing freight, commodities along with home pricing and travel destruction.
The FOMC meeting tomorrow will be more important than any earnings and cannot foresee any change in their glid path. If anything, Powell will be more dovish as he just has no backbone at all and usually caves to the markets causing a relief rally.
For Dynamic Alpha we remain in 35% cash down from 43% yesterday and overweight defensive names with a tilt toward Healthcare as the system waits for better opportunity to get long higher beta names.
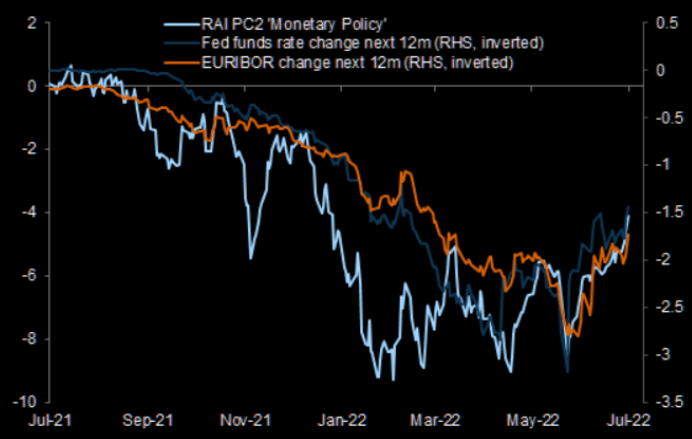
Lastly, we are now about at the deepest inversion on the 2/10 yield curve as 2000. So who is right here? Equities compliancy at 3950 on the S&P 500 or Yields?
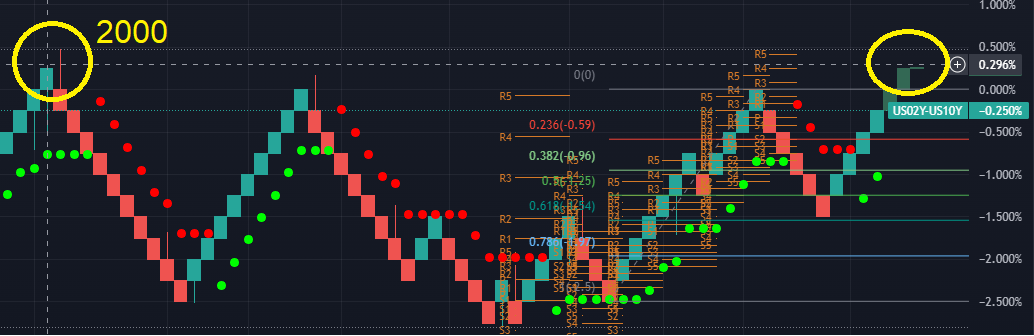
Friday 22nd Post Market Close
For those of you reading carefully over the last few weeks, you had ample time to reduce some growth and higher beta equity exposure yesterday when the S&P 500 and NASDAQ (futures) hit our first target of 4,000 and 12,350 respectively. Furthermore, we said we would be aggressive sellers of the riskiest parts of the markets when the S&P 500 and NASDAQ (futures) hit 4,170 and 12,950 respectively.
The question remains: can the later targets be achieved within the current bear market rally? Clearly, no one knows the answer as visibility of earnings and the Fed 27th meeting are wild cards. What we do know is that this is the most widely forecasted recession call we have seen in 20 years and consensus is usually not an alpha generator. Let’s take a look at some data points we believe are significant as of today’s close.
- Yields: The 10 year yield closed down -3.68% at 2.72, a level we have not seen since April 18th. Yields across the curve fell as PMIs in the U.S. and Europe today came in weaker than expected.
- Yield Curve: Slight improvement but nothing to be happy about as the 2/10 yield spread is still inverted by .22. Clearly a sign that economic contraction is not getting better. German yield fell the most since 2008. Not good for the largest European economy.
- Positioning: Like we have shown in the previous emails, CTA’s and systematic investors are net short most likely have caused most of this rally in short covering. Additionally, as we showed in yesterday’s email the Long / Short equity universe is the most underweight equity beta exposure in 5 years. All this has caused a short squeeze followed by FOMO and this is why we thought reducing exposure for three weeks at S&P 500 and NASDAQ (futures) hit our first target of 4,000 and 12,350 was prudent.
- This week we saw a rally in growth right after the largest jobless claims in 8 months, signaling wage inflation pressure will subside and the Fed would reverse Hawkish policy. Many trading desks are even saying come Dec 2022 the Fed will cut rates. Not so sure about this, that seems like a bold call.
- Next week is going to be the biggest week in Months as earnings from MSFT and other bell weathers give clarity. Every signal top down manager is waiting for next week’s company to report as they think these earnings will be the catalyst to drive markets significantly lower. However, so far negative earnings events have had the opposite effect on the index level.
- The S&P 500 pullback was a non event in my opinion as we closed off the lows. Our S&P 500 Model
Three weeks ago we said the narrative was changing from higher rates and no peak inflation to now rate cuts in 2023 and consensus CPI 3% by December. Who really knows how this plays out, however, here is another reason why we are rallying. According to HFR, Long/Short Equity beta exposure is at its lowest levels, no one is long stocks in this space!!
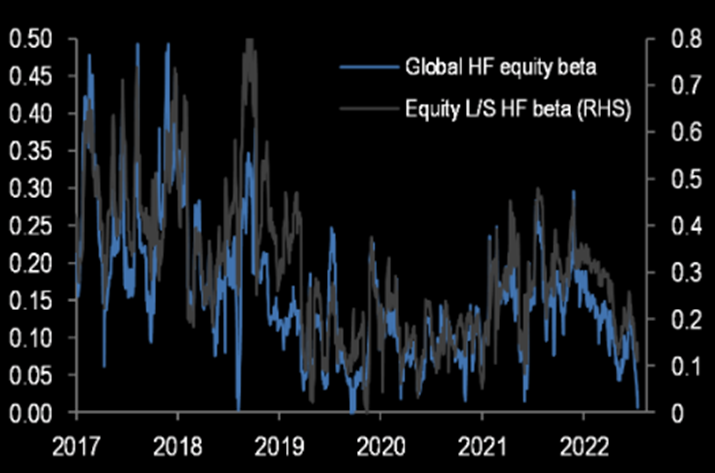
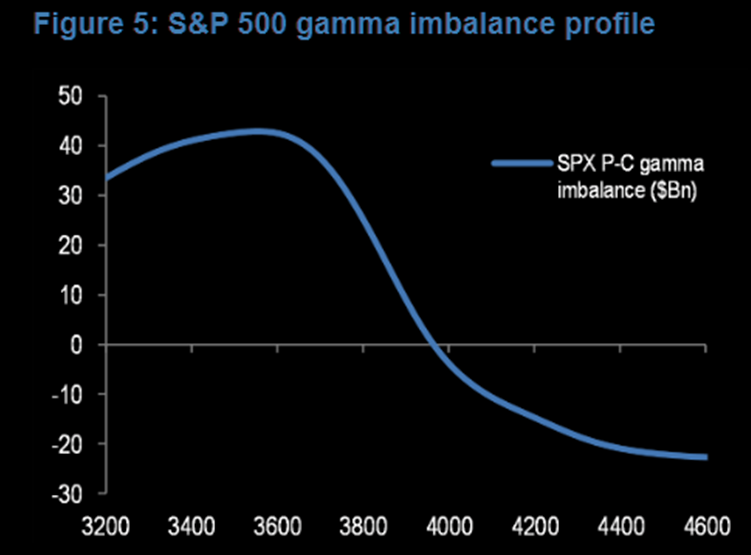
The dichotomy: The push and pull between weaker economic data and the path of lower rates will continue to cause volatility. Today’s jobless clams ticked up to an 8 month high. The initial reaction was the NASDAQ rallied 90 handles as growth obviously is seeking lower inflation. Although this obviously comes at a cost. As we mentioned early this week, we wanted to reduce a little equity exposure if the S&P 500 reached 4,000 and aggressively at 4,170 respectively, but so far we only got to 3,979. However, remember, when you are coming off these lower reading as seen below, the initial phase always sees back and fills. We are just as bearish as the next person solely based on the last 3 years of the increased money supply and the expansion it had on all asset valuations. However, we need to be aware that the market has been pricing in rate cuts for 2023 and beyond as stated in our previous emails.
Our S&P 500 model is now at a critical reading. We moved from -66 to -48, as many of you know, once the model moves back above a -54 Dynamic Alpha is allowed to buy. The model is now 55% allocated and the rest sits in cash. The model has been purchasing defensive stocks this week like TAP, HUM, TMUS, MCD MCK, SYY, UNH and only two higher beta growth names QCOM and NVDA. However, these names will not lead us higher except semis if the market continues this next leg higher. Our S&P 500 model must continue to increase or if the S&P 500 could easily stall here at -48, a move back to 3725 on the S&P 500 is within reason.
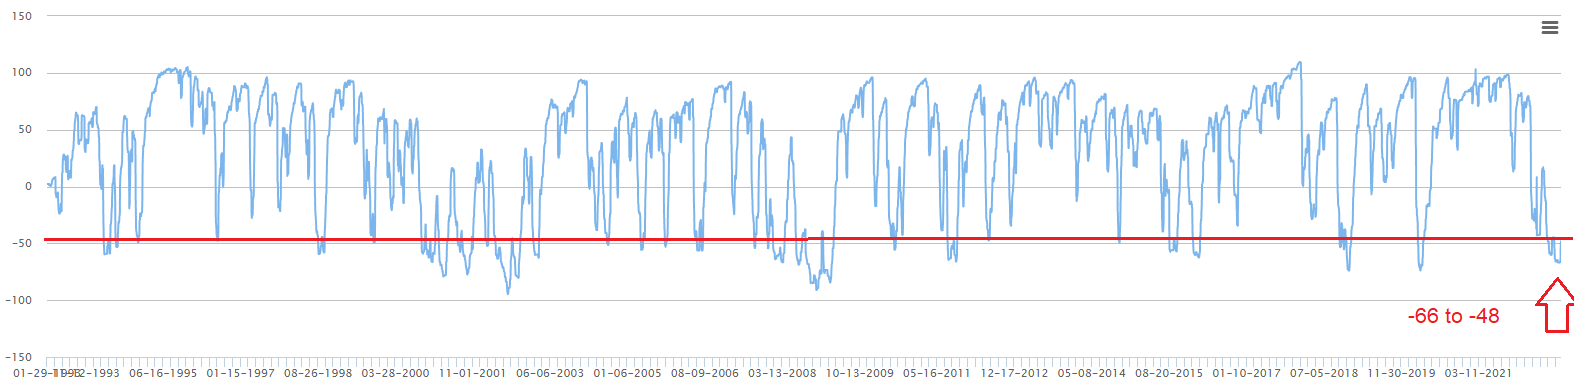
The Close:
The hardest thing to do is fight our emotions. While we were extremely bearish in May and looking for the S&P 500 to test 3,500, which is still possible, the data has changed. The data of consensus forward looking inflation via CPI is that data point that has caused the forward rate expectation to cause a bid underneath the market.
Our S&P 500 model had a large increase today allowing Dynamic Alpha to add to the portfolio and taking our cash level from 80% down to about 40% now. We are not fully committed in Dynamic Alpha and unless the market can truly break out, the models will try to add a little alpha as this may be just another bear rally.
A Few Key Points:
- Yesterday we said Apple’s news was not a catalyst and we believed it was built into the market.
- This current rally started on July 5th when we discussed a reversal in the Semi’s vs Utility buy signal.
- For the past 3 weeks, the market consensus on CPI has significantly declined helping growth find a bid and economically sensitive interest rate stocks as well.
- We have been discussing that the narrative over the past three weeks has changed in a bullish manner as rate expectations have been declining for 2023 and 2024 as peak inflation was being priced in from higher frequency data.
- We have been waiting for a bear market rally to reduce exposure at (update) 4,050 and (same) 4,170 on the S&P (futures) and NASDAQ 12,330 and 12,900. Much more aggressive on the 4,170 and 12,900. Sentiment is so negatively skewed that we can see the later levels without the trend dynamics even turn bullish. We would not de-risk that heavily at 4,050 or 12,330 and now focus on the upper range is achievable.
- Expect a close on the S&P 500 above 3,950 will be a slight game changer and will cause systematic traders to just start to flip to the long side and 3% to 6% upside as we discussed will be nothing to achieve.
- Trowbridge’s Dynamic Alpha is 80% in cash. However, after today our SPY rating model had a massive increase in strength and the portfolio will be adding 18% in more defensive stocks and 9% in semis.
Extreme positioning lets see why a massive rip to 4,200 on the S&P 500 is nothing. The first Chart is the B of A Fund Manager Survey. The second is B of A sentiment indicator. Keep in mind Michael Hartnett who created this indicator, believes the S&P 500 is heading to 3,000 to 3,300 still!!
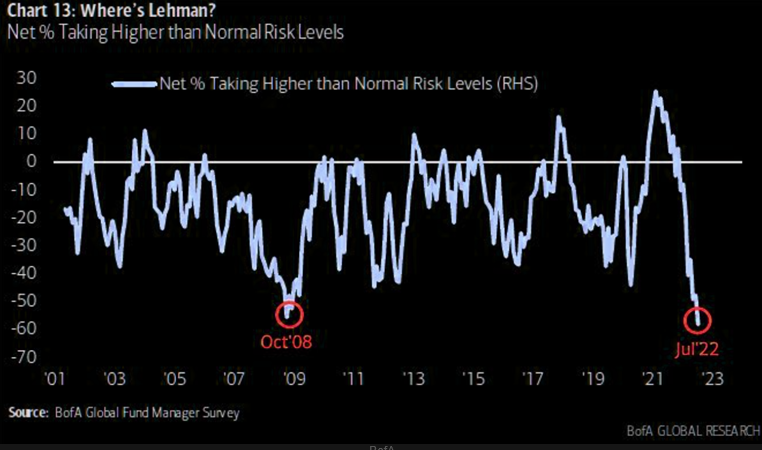
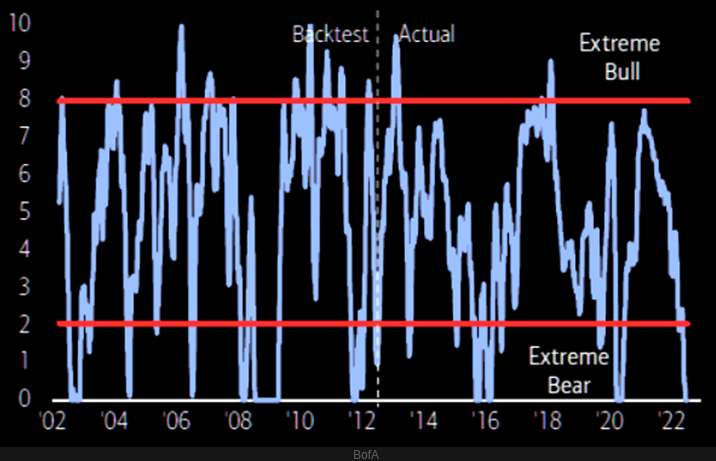
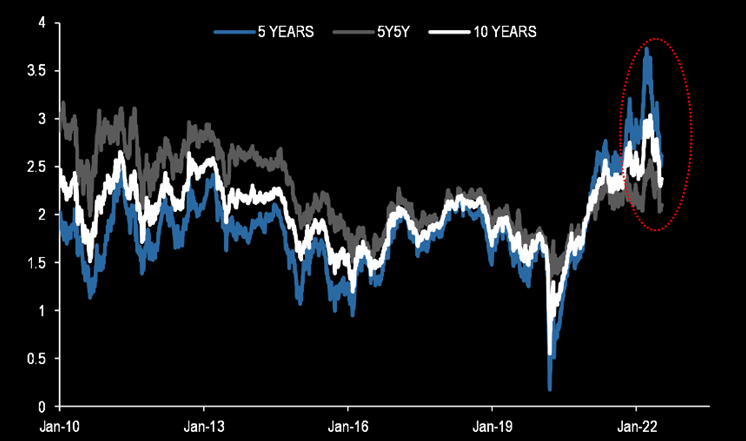
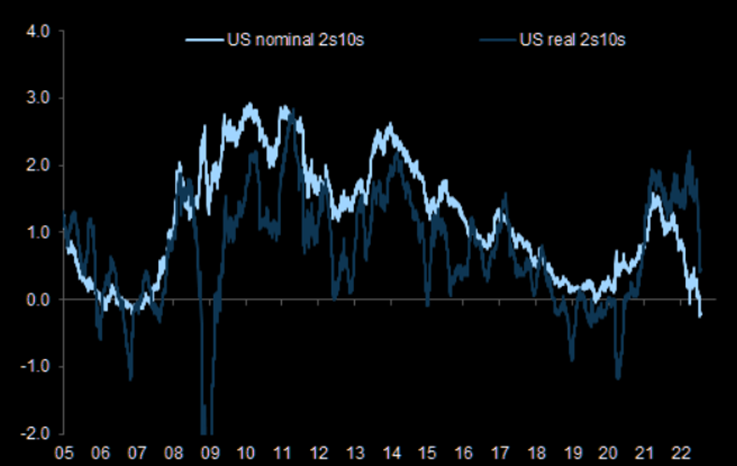
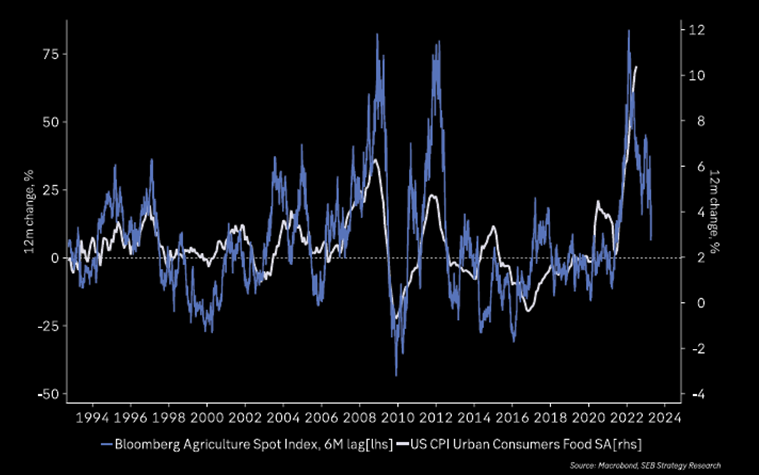
- We have been telling investors to reduce Growth exposure if the NASDAQ (FUTURES) gets to around 12,350 and reduce S&P 500 equity exposure at 4,000. We also did state that if we did get lucky enough to hit 4,160 and 12,900 respectively on the S&P 500 & NASDAQ (futures) to get aggressive reducing equity risk/exposure.
- Recession is irrelevant now. The market has priced in that a soft recession is now highly probable. This is now irrelevant as the market is now looking out at deep rate cuts. To get full clarity we have the bulk of earning in the next 14 days and if they are anything like CitiGroup today “C”, it will be extremely challenging to retest the lows. We not sure we will get a retest of 3,630 or see 3,500 as we suggested in May as now the market has started to price in almost 150bps of cuts between 2023 and 2024 as reference below by Goldman. You can speculate once the summer is through that spending will start to decline. However, we rather not try and forecast the behavior of the U.S. consumer.
- FOMO: Positioning is still very light to the long side by systematic quants and hedge funds so another 4% to 5% upside is not out of the question. We expect some FOMO (Fear of Missing Out) from asset managers that cannot afford the S&P 500 to rally 4% without them and causes buying to the upper levels we discussed before drawing everyone in before reversing.
- As we have said that for 2 weeks, the market was smelling inflation has peaked and the Fed has gone too far causing deep economic contraction causing the rate curve to price in rate cutes. Today the markets rallied off the back of worse than expected University of Michigan numbers where inflation expectations dropped like a rock as seen by the Bloomberg chart below. in my opinion, this is why we are now seeing an early cycle trading of small caps gain steam throughout the day in the Russell. We are seeing a little of growth names rollover, but they have firmed up in the last 2 weeks and now we need alpha in the next factor.
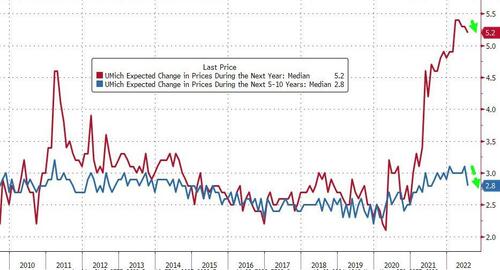
- For those of you who have Gold allocations, keep an eye on the dollar. It might start to have a little reversion here which will firm up Gold. GLD has a lot of support at $158. Not sure the run in the dollar is over just yet. But this is something to watch if you are an allocator of Gold.
- Negatively Positioned: Systematic trend following strategies are very underweight long exposure. Beware of the bear market rally.
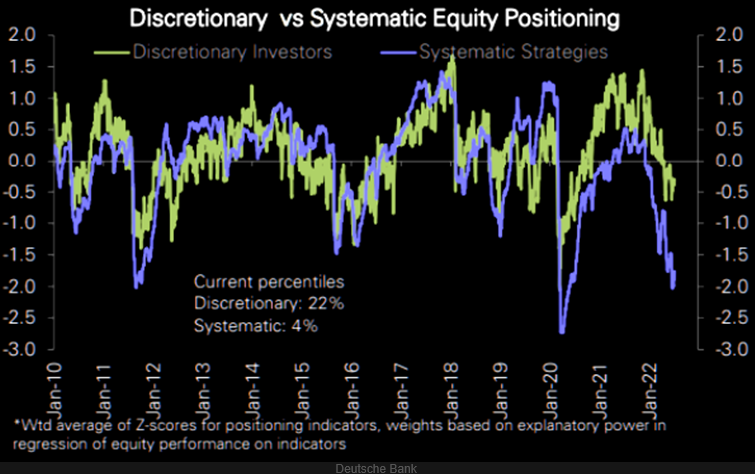
- Today should not come as a surprise within the Growth trade. We felt back on July 11th Growth would catch a bid.
- July 5th, we stated as well, “A very typically trade that attempts to signal a bottom in growth in a recession is when semis gap down and close green and you have a 3% to 4% variance vs. utilities, which occurred today. My guess is the markets are signaling the recession is underway and the Fed is going to have to easy up on tightening sooner than previously expected causing growth to firm up. Below is a 4 hour chart of Semis (SMH) vs Utilities (XLU). SMH vs XLU on the downward channel or 3 standard deviations is trying to revert to the mean (redline)”. Here is the chart we reference for the SMH-XLU, the trade has a little more to go before running into resistance.
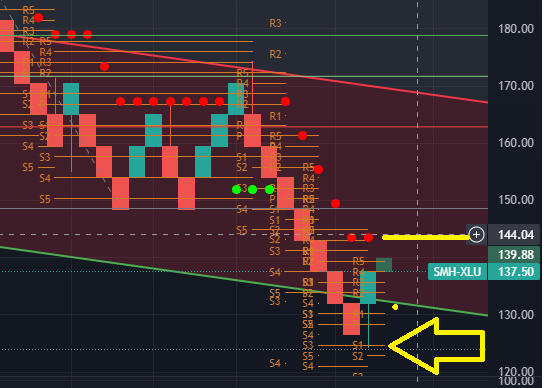
- We have been saying for 2 weeks the market was starting to price in more cuts as the 2/10 yield curve inverts greater and this is exactly what is happening. Here is what Goldman is pricing in as for rate cuts going out to June 2025. This is exactly why Growth is catching a bid as the market believes the Fed has gone to hard to fast and now a few banks are calling for balance sheet rollout to be halted mid 2023.
- A very bullish equity catalyst from Bank of Americas top rate strategist Marc Cabana said Thursday his team is slashing its 10y Treasury end ’22 forecast from 3.50% to 2.75% and end ’23 forecast from 3.25% to 2.50%. The BofA economics team now expects 100bp of Fed rate cuts between Sep ’23 and Jun ’24. Cabana’s base case for Fed cuts in 2H23 is expected to occur with an end to QT as stated below.
We expect the Fed will stop QT with rate cuts due to the contradictory signal it sends on monetary policy and to simplify policy communications; the Fed will likely not want to be easing with rate cuts but tightening with QT.
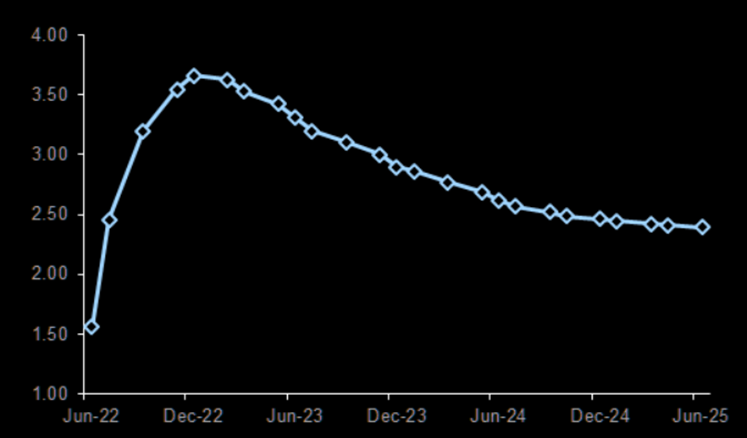
- Today played out exactly as I expected from my July 11th note, a hotter than consensus CPI print would cause a sigficant initial selloff that would be bought in Growth. The market has been signaling faster frequency data showing inflation is peaking caused Growth to be bid.
- The CPI print was actually hotter than the UBS’s analysis we noted on July 11th, which was the most bullish on the street. However, UBS and Bloomberg Consensus all have CPI significantly crashing to 3.5% by Dec 2023.
- The market did sell off late day a little however, as Atlanta Fed President Bostic said everything is in play regarding 100bps move. However, the WSJ came out early morning as they are the Fed Whisper and said the Fed will not move 100bps.
- The STIR “short-term interest rate,” market has already priced in a 60% chance of a 100bps rate hike in July, which we highly doubt this will happen. However, the STIR market is also pricing in bigger cuts in Q1 of 2023.
- Below the we have the 2 / 10 yield spread. It is the most inverted since 2000, at -.25bps. Obviously 2020 we didn’t invert as hard as QE came into play with lower yields.
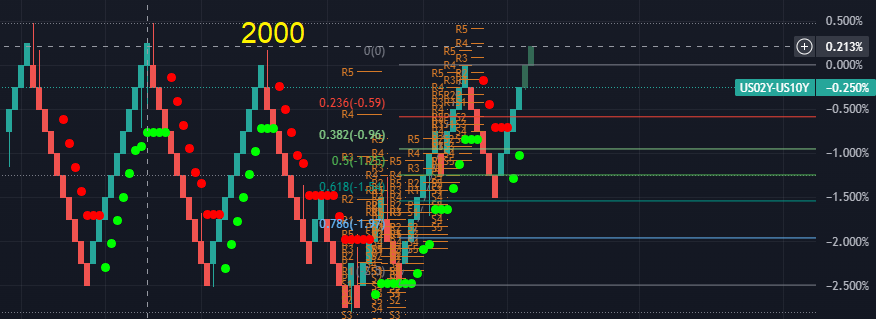
- Crude oil was down 8% German investor confidence hit its weakest levels since 2011 since the EU debt crisis. Then we had the US NFIB Small Business Outlook hit a record low early morning.
- The 2/10 spread inverted the most since 2007!
- Late afternoon around 3:00 there was a fake press release on tomorrows CPI by BLS that sent the markets lower. The annualized CPI was only 8.60% in the fake report and increased 1%. Ridiculousness, but interesting to see the reaction on a CPI that come in at consensus.
- As previously discussed yesterday, I can see a 9% annualized print having the S&P 500 trading down to 3,725 and being bought and bouncing as investors will once again call this print the peak. Oh course this is a trading, not longer term rebalancing or investing. Commodities as seen below have crashed and the market will look passed a much hotter CPI print tomorrow.
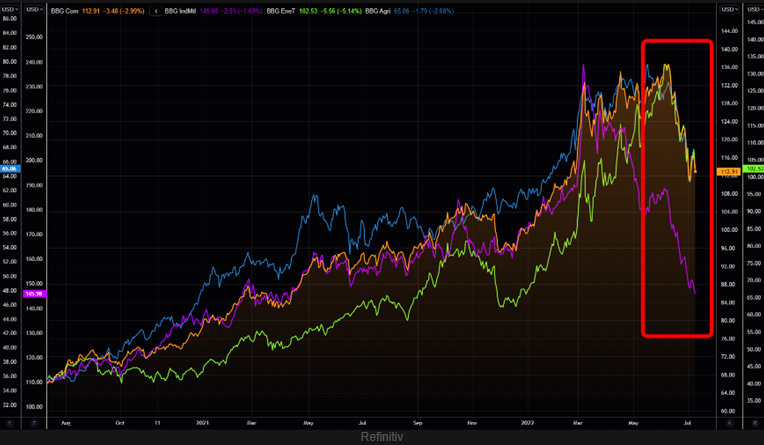
- EUR/USD hit parity as investors move to the strongest economy in the world as Europe does not look pretty.
- Really nothing actionable in terms of regime changes on the asset class or sector level to highlight.
- The bad news is the best 2 weeks of the year are about over as seen by the chart below by Morgan. Interestingly enough, there has not been really preannouncements for earnings, this leads me to believe there is a chance, guides wont be as bad a feared.
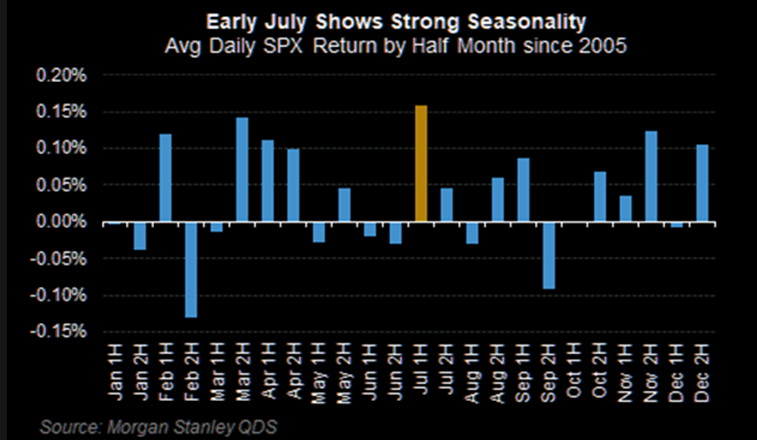
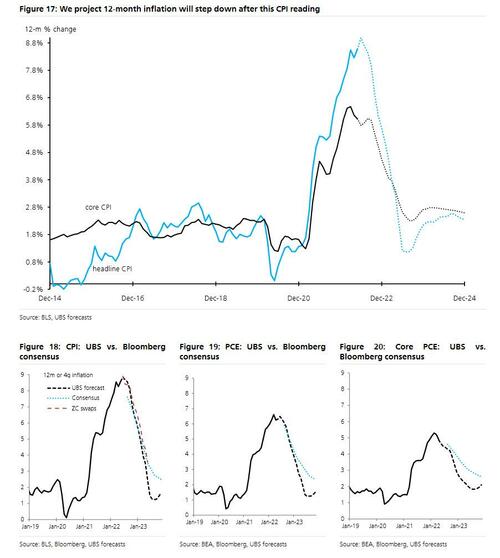
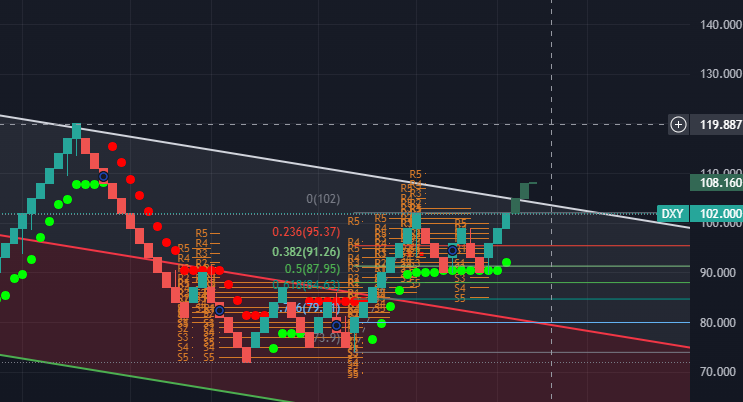
- The signal we discussed of SMH/XLU on July 5th is usually good proxy for risk on. As we said expect a few days for Semis to rally as we say a large outside day on Semis vs. utilities on Tuesday. Is this a long term signal that a bottom is in? No but you do get powerful counter trend risk on rallies.
- Our stance is the same from June 24th, ” As we have been saying for a week, expect 4,000 and 12,330 respectively on the S&P 500 and NASDAQ “Futures” as markets are oversold. The most bullish case would be 4,167 and 12,900 respectively for the S&P 500″. The most bullish cash we would reduce significant exposure to growth.
- Sentiment and positioning are at very extreme levels even if we go into recession. This means another 3% to 6% higher is not that unforeseeable. This would give you the top end of our bull case.
- Credit rallied today for the first time with equities a slight positive.
- The 2/10 spread is still inverted by .03%. Not bullish.
- Rates moved higher today as several Hawkish speak from Fed officials ( Bullard and Waller).
- Bullard said Urgency to take care of inflation as soon as possible.
- Waller says climb in house prices of last two years are insane and markets are expected a recession so lets get it done.
- This week is purely a short squeeze as the most shorted stocks are up 13.5% since Tuesday according to Bloomberg.
- Mortgage rates had their biggest drop since 2008 a .40bps move!
- Oil ripped not on supply and demand but on a supply issue in Texas power gride.
- Tomorrow we have a big print for payrolls, if they come in stronger than expected Growth will get hit hard. However, the markets are expecting a moderate number after Wednesdays Jolt numbers.
- Here is a nice chart provided by Kantro. Here are the magnitude of the bear market rallies of 2000 to 2002.
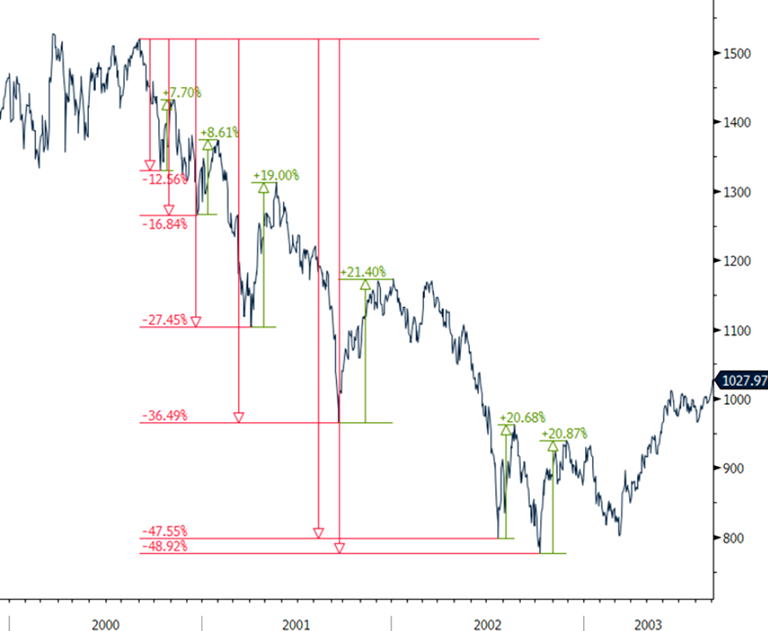
- Fed Minutes typical relief rally on baseless data points. It’s way to premature to determine anything on the Feds path.
- 2/10 spread still inverted by .03bps, not positive, the longer you are inverted the more valid the signal.
- HYG which we can use to gauge the credit market was down -.18%, certainly telling use that the credit market didn’t believe todays rally.
- Crude oil rallied back 3% off the lows as the U.S. imposes sanctions on Iran oil producers after failure to embrace a nuclear deal.
- If you are still overweight technology, lets see if we can test 12,300 on the NASDAQ futures before reducing exposure. This is a level we have been discussing for the last two weeks.
- As we noted yesterday, the move in Semi’s was very positive and could rally for a few days as Utilities broke lower yesterday a signal that occurs at the oversold conditions.
- As for the S&P 500 4,000 is still a level I would reallocate to more defensive sectors or stagflation beneficiaries which are utilities and staples. I would not add these at 4,000, reduce cash and wait for a pullback before allocating.
- The U.S. Dollar on an absolute rip higher hurting energy names unlike the demand destruction that has caused the recent downturn. Regardless of fantastic cashflow and fundamentals this is no longer relevant as the market is forecasting demand destruction. The funny thing is recessions rarely have the demand destruction the market expects on the producers and exploration stocks.
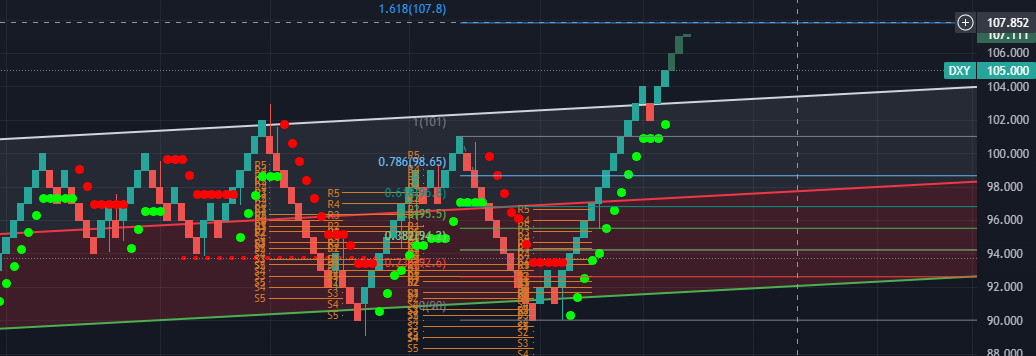
July 5th
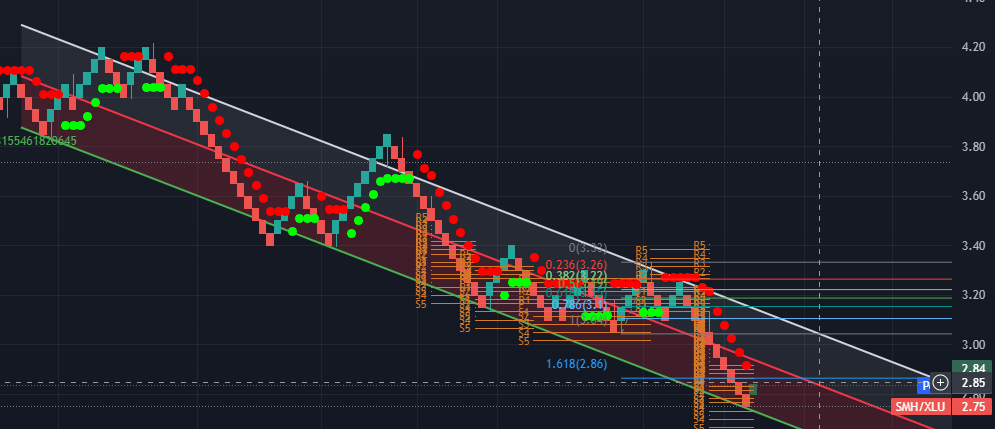
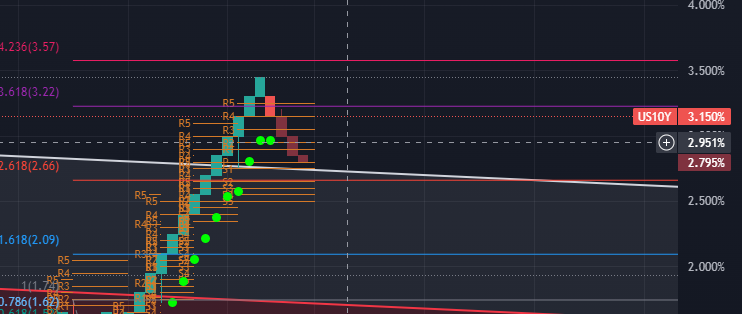

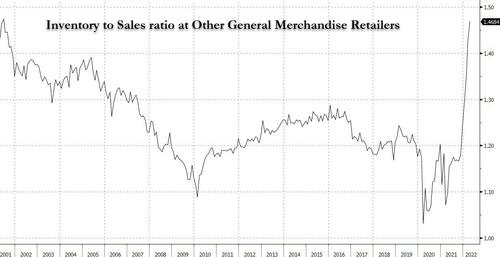
March 12th
The Close
Surprisingly the NASDAQ was actually very strong today even though it closed down 108 points. The 10 year yield traded up 5.35% to 1.625%. I would have expected a weaker close. Now next week we have quarter end balancing on the momentum factor and expect this to cause additional pressure on technology as almost all tech is in the highest momentum scoring.
Not much else to report, I expect the same themes to continue for the short term, however financials and energy are getting a little extended here.
Premarket
Do not be tempted to buy todays dip in tech, the 10 year is at a vantage point here almost 1.62. Either is falls and the NASDAQ will stabilize or its going to breakout. I do believe it will see 1.75 in short order over the next few weeks.
March 11th
Today the reinflation trade took a breather as the NASDAQ ripped higher. However, the NASDAQ failed to close above the 13,220 level we discussed in prior days. The index is now 7% from its all time highs yet, the RUSSELL and S&P 500 closed at all time highs. I am still a seller of the NASDAQ and like the reinflation sectors. However, XLF and XLE are slightly overbought so I am not a buyer here. We have been bullish in the Russell for months and take a little off is not a terrible idea. However, in the longer term that reopening trade has legs higher.
As for the S&P 500, 4,020 seems like the logical next stop.
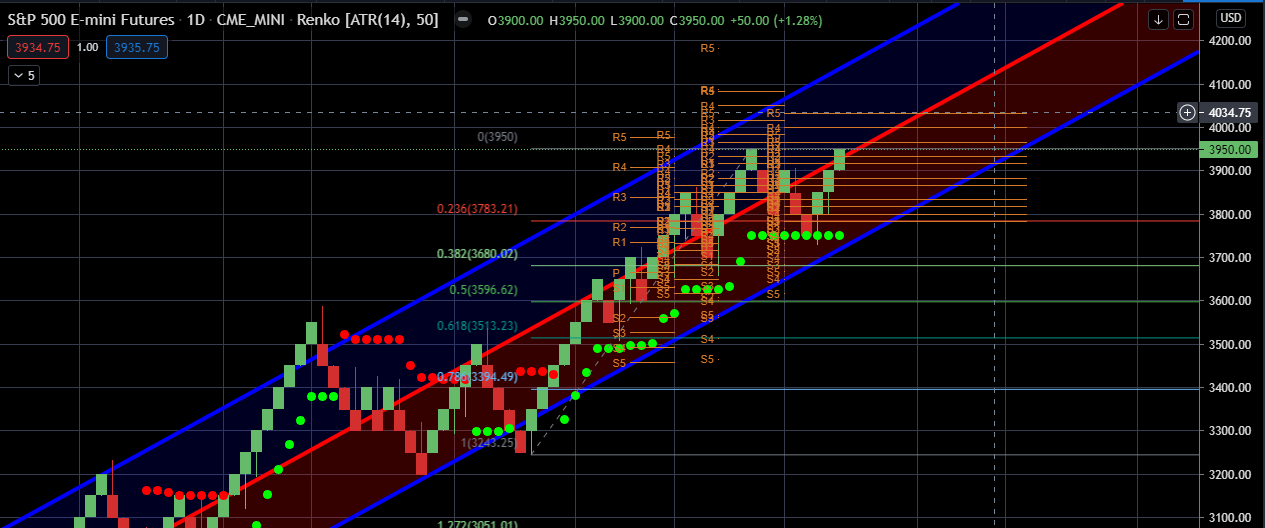
As for the NASDAQ you can see the 13,220 level I am referring to. 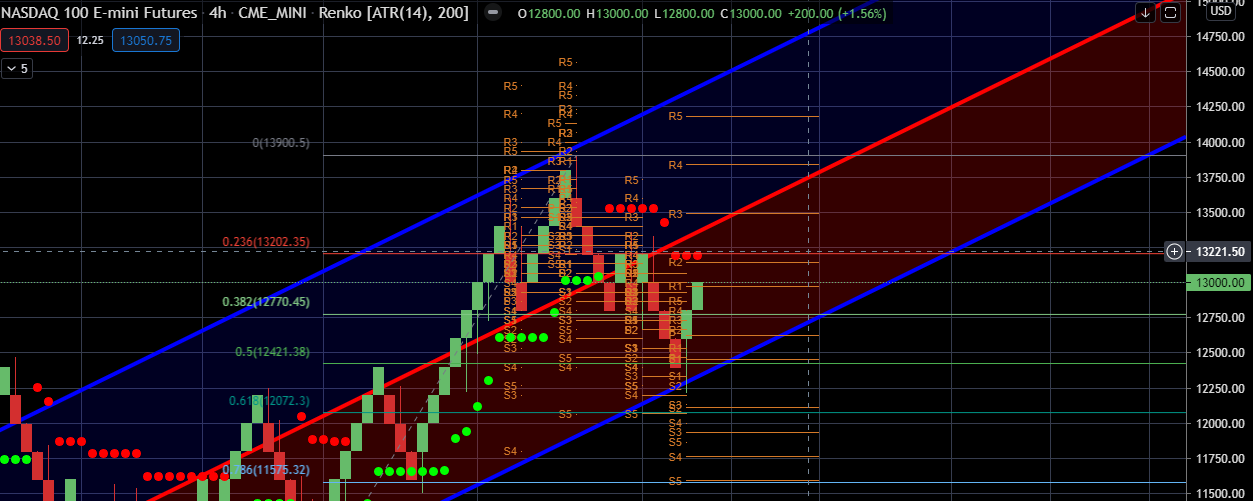
March 10th
So the CPI came in line, if you really believe the number, which I do not believe on what the BLS stated. As reported by Zerohedge: The BLS is basically just admitted it is all BS…“data collection in February was affected by the temporary closing or limited operations of certain types of establishments. These factors resulted in an increase in the number of prices considered temporarily available and imputed”
However, as I mentioned if the number was perceived to be good you would get a massive rally of 500 points. However, that was before the NASDAQ was up 500 yesterday. 13,220 is the next major level of the NASDAQ, in which case I would reduce technology holding. We have a 10 year auction today, this will be important for tech. IF demand is strong tech will rally even further today.
March 9th
Very impressive, but machine driven rally off the back of a 4% lower yield on the 10 year. Do I think today was really buyers, no! I don think this rotation is done yet, however, that’s not to say we wont get some mean reversion in the reinflation trade and tech. The NASDAQ (futures) needs to close above 13,230 to really get back on solid footing to make an attempt at its old highs. Unless rates take a meaningful move lower, I find it hard to believe this will happen in the short term.
As mentioned, tomorrow has a big catalyst in CPI. That will dictate the next move in the NASDAQ.
March 8th
Today was rather painful for the NASDAQ, at this juncture everyone has had the chance to reduce tech exposure as we have been saying for months. The NASDAQ is not oversold yet, to get to an oversold level you would need to see about 11,500 on the NASDAQ futures. I am not saying we get there, I don’t try to predict how low indexes go!
I expect Wednesday to be a monster move for technology as CPI will be reported. If the number comes in hotter than expected the NASDAQ will get killed. If CPI comes in much lighter, we will see an up 500 point day.
Don’t make the mistake like many investors fall into historical bias. What worked so well in the past does not mean it have to continue to recover. To put this in perspective, we always discuss Apple. Apple for the last decade grew earnings at 8 to 10 times and traded at 8 to 10 times earnings. When Apple traded $135 it was still growing earnings at 9 times yet was trading at 35 times earnings. This multiple expansion is only because of low rates. There is no reason Apple cant trade at historical multiples if the 10 year yield normalizes back to 2% and above.
The other reason, we are getting a continued rotation is quarterly rebalancing of the momentum factor. Remember, momentum is calculated blending 6 and 12 month returns. This means momentum funds that have been long Apple, NVDA, GOOG and all the 12 month best performing names are know longer in the top quartile. As these names fallout of the top quartile they are sold and replaced with the new quartile stocks.
Lastly, do not listen to talking heads on TV that say rising yields are just fine for the market!
March 5th
Friday we had a massive rally off the Russell’s lows and an impressive rally off the NASDAQ. The Russell had a 7% round trip. My opinion sill is stead fast, sell technology now on any rally, the sector is going to be challenged as real rates are going higher. I still think pro-growth cyclical stocks along with energy will work for the foreseeable future. The S&P 500 model is now at a 70, rarely do we reverse from a 92 or greater and fall only to a 70 reading. So I do expect volatility to remain.
The good news for the NASDAQ as seen in QQQ the Counter trend is now a -6 and worked off a tremendous overbought -77 level. The bad news is historically the rating value does continue to weaken from its current .29 reading after being overbought. The only positive thing the NASDAQ has going for it is the Semiconductor strength, but I expect this to be short lived once the supply chain disruption is over.
I do believe as I have for many months, higher rates are a real game changer for higher multiple stocks.
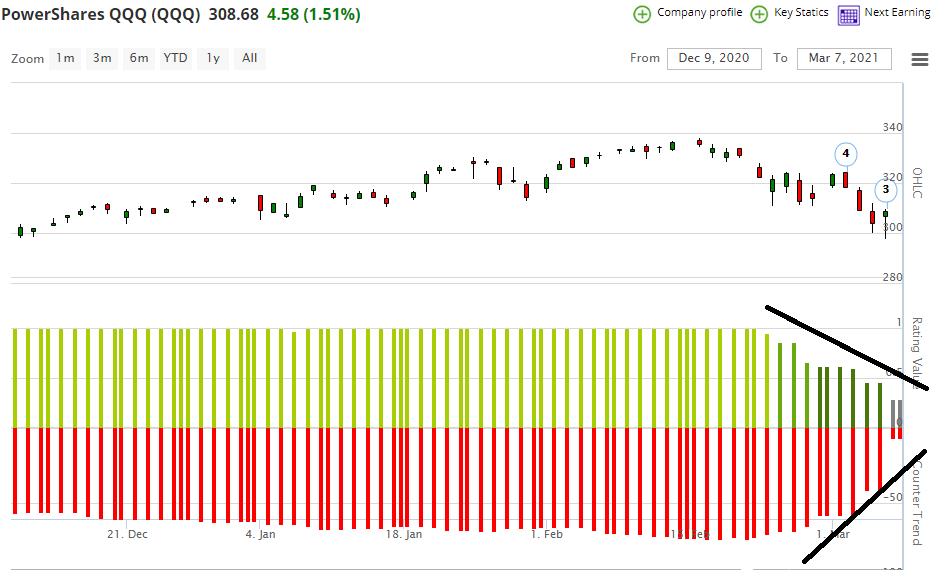
If you have a high level of cash and feel the need to put capital to work, stick with stocks that rating values are increase of CT that are still declining. This is what the scenario would look like.
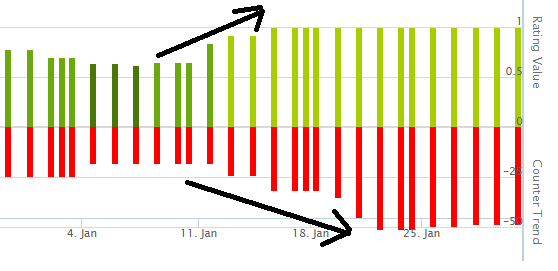
As we have mention for several months would be the best sector play for higher rates. XLE is now a -62 counter trend not yet overbought and $53.88 is a massive level it needs to get over and close. A close above this level, XLE will run further. But keep watching the CT (counter trend for extreme overbought levels)
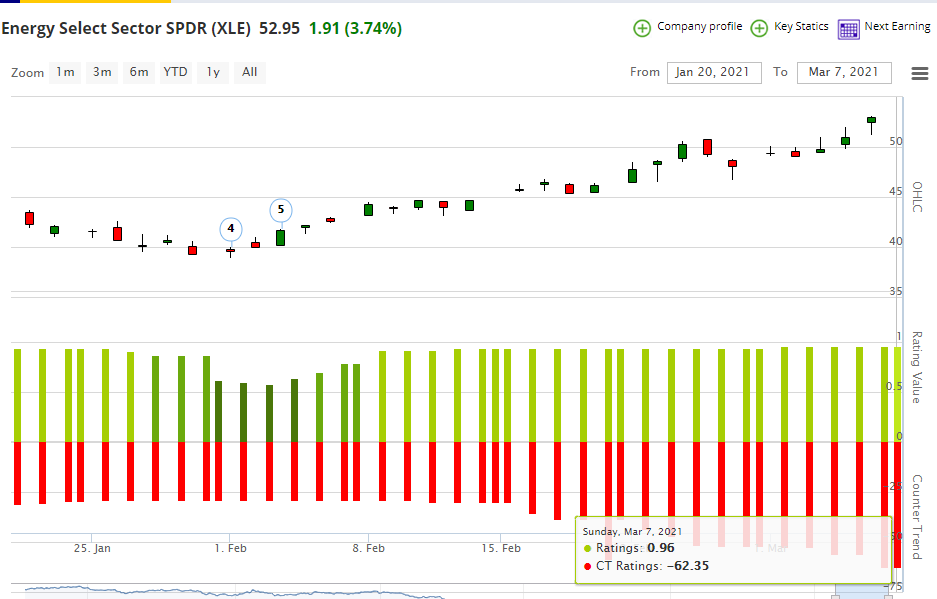
March 3rd
So today was rather ugly. We last said we expected the 10 year to retest 1.27% and tech bounce at which point I would be a seller. Well tech bounced on a small decline in rates but not 1.27%. Many of you should have had plenty of opportunity to sell into Mondays rally. We haven’t seen anything yet with these high multiple names if rates really do breakout. Anyway, I am still avoid tech here and waiting for a much better level to reengage.
Maybe tech bounces tomorrow, but another up 250 to 300 points on the NASDAQ I am selling.
Feb 28th
What I am watching for the week to come. I expect to see the 10 year yield to retest 1.27% and tech possible rally a little which I would be a seller. I think the 10 year yield will bounce off the 1.275% level back to 1.50% and cause more pressure on tech. I expect the Fed to really start jawboning this issue of higher yields, but I think it will ultimately have little effect as rates ultimate will rise to 1.70% as the economy reopens fully.
One of the biggest poster child of multiple expansion and not earnings expansion is Apple, as seen in the second chart, Apple is starting to take out almost a 10 year upper trend line. I think for investors who haven’t seen a rising rate tech rotation are going to cause some panic with running for the exits.
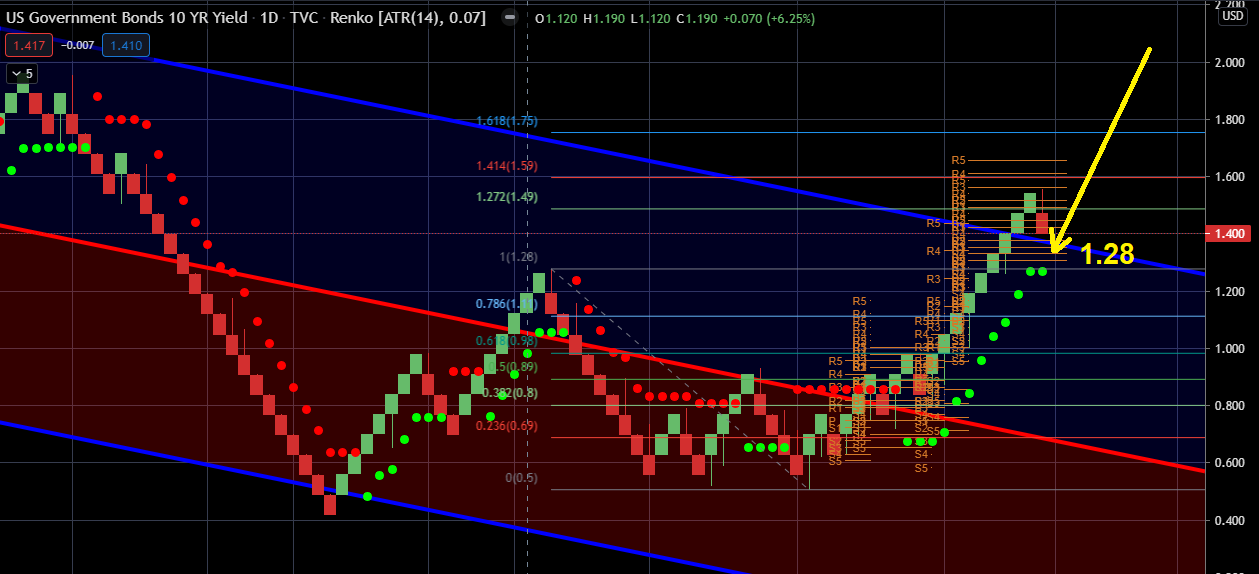
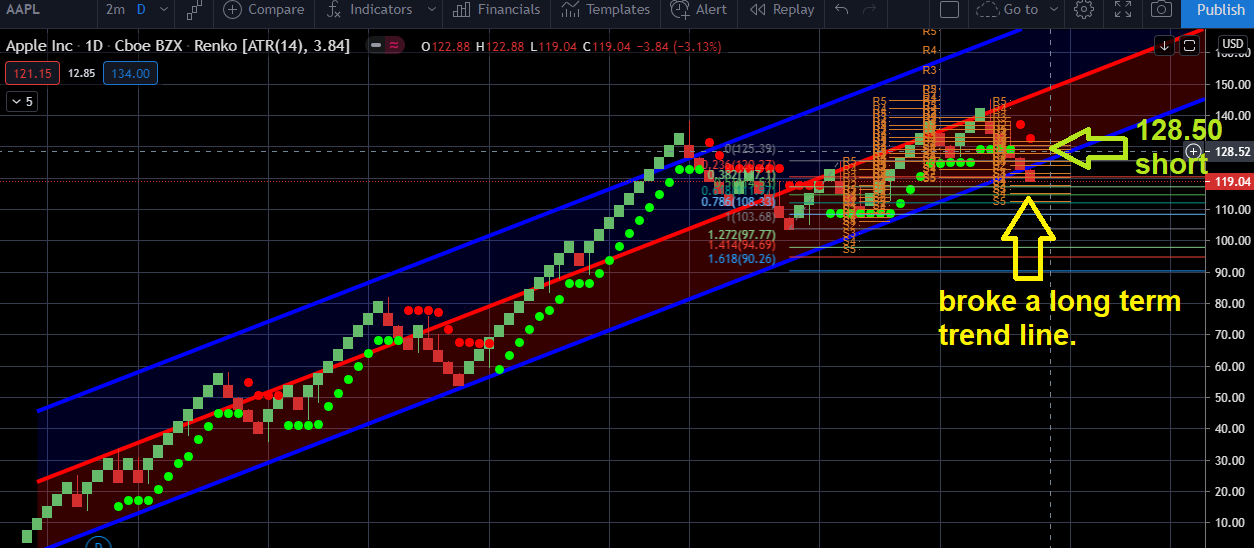
Feb 25th
So today felt bad understandably. But this we saw coming from a mile away for weeks. I still don’t think there is an opportunity yet to get long anything. As we have said, I am not watching levels on the equity index’s, only rates. I would like to see the 10 year yield consolidate here, but doubt that is going to happen. The next big resistance level is 1.599%, if we close above that level, we are in for a lot of pain as the next level is 1.75%. If rates did test 1.75%, I would think that would bring some opportunity to get long equities.
Amazing, all those investment talking heads who have been saying for months they weren’t concerned with a 1.50% 10 year yield as it must mean the economy is getting heathier! That maybe true, but equity risk premium will contract as yields rise regardless.
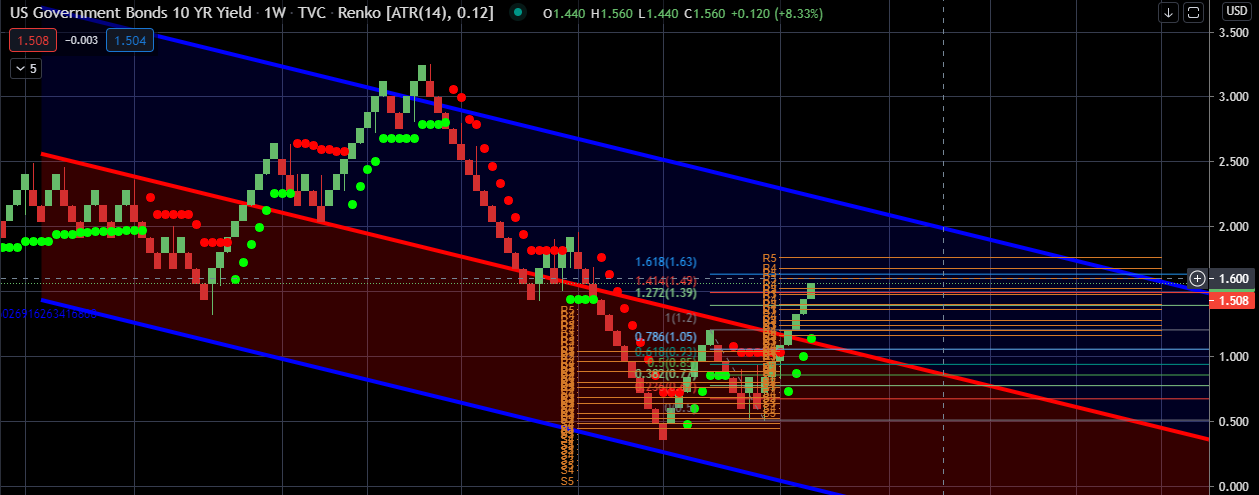
Feb 23rd
Impressive close for the S&P 500 and NASDAQ. However, the NASDAQ couldn’t hold the gains. Technically, the close was bullish. However, the only thing I care about are rates. Today Jay Powell tried to talk down rates by saying there was no real inflation. He did a fair job at best with the 10 year close around 1.34%.
I am still not a buyer of tech at current levels. Additionally, many smart beta, multifactor momentum based funds that rebalance quarterly will be sellers of the biggest 12 month winners. Additionally, I would expect some of the biggest recent 6 month gainers like energy will be added to their portfolios.
Feb 22nd
As we have been saying for months now equity risk premiums will adjust if rates move higher. We mentioned 1.50% on the 10 year as cause for concern because the S&P 500 is yielding 1.50%. We also mentioned that high multiple tech names would get hit the hardest. Today the 10 year yield got up to 1.395 causing pressure on the NASDAQ. As long at the 10 year yield continues to climb, I would not touch technology. The NASDAQ (futures) did close at a key support level of 13,220. However, I don’t think buyers will step in until rates test 1.50 and fail. Until there, too many inflationary sectors as we have discussed are working.
Feb 16th
Today we got a nice break out on the 10 year yield that we have been looking for and now the 10 year is stilling at sizable resistance at 1.280%. Yes, I do believe, 1.50% is meaningful as that will be parity with the S&P 500 yield and system traders will adjusted both risk and reposition portfolios. When you hear investors saying that they wouldn’t be concerned with a 10 year until 2.5% to 3% I couldn’t disagree more. Valuations and equity risk premiums are so tightly correlated to rates, especially right here that any little upset will cause a painful pullback.
As we mentioned, the sector that will perform the best is energy and in terms of asset classes, real assets will do well if inflation does truly start to creep back into the economy. I do believe that with the highest savings rate in 40 years and the pent up demand we will see inflation by the summer time. This will be a double edge sward depending on how rates rise.
Feb 12th
The S&P 500 model is getting close to that vital level of 95. One thing I am looking at again is the 10 year yield once again. Once again it is testing 1.20%. I do think a 1.50% yield will cause a reset and put pressure on equities as the S&P 500 is currently yielding 1.54%.
10 year yield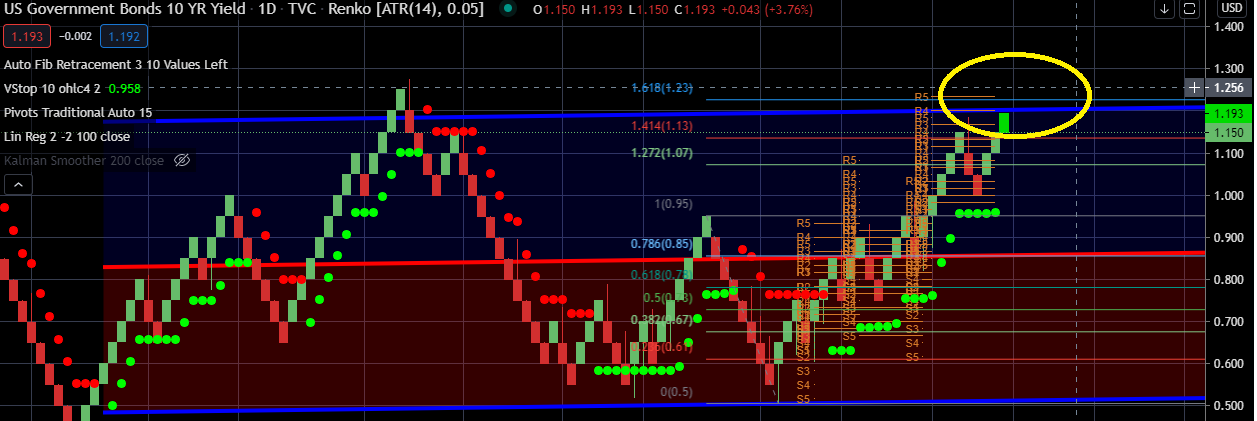
S&P 500 Yield 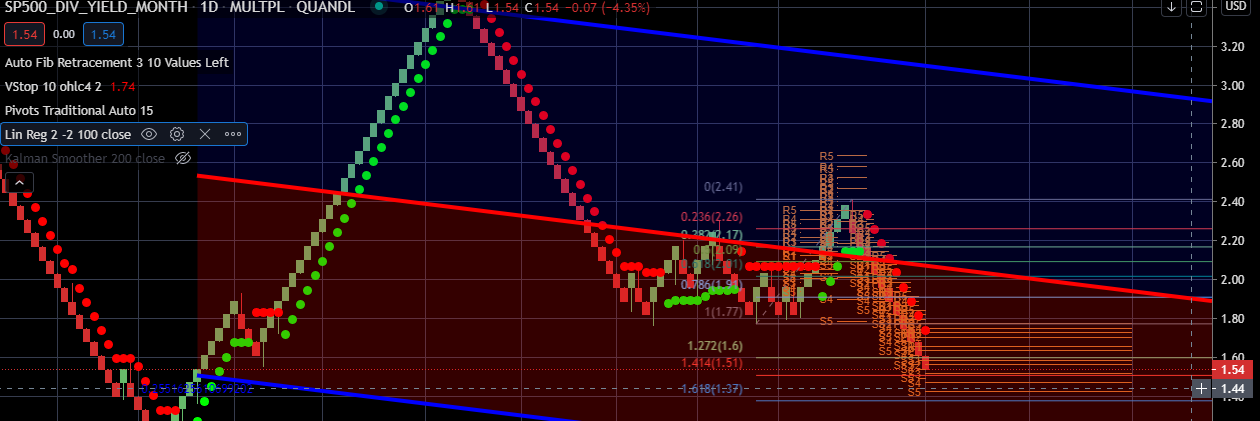
Inflation: every investor is now looking at inflation, will it finally come. I do believe we will ultimately see some and having the right allocation will be more important than what we have seen over the last decade. Commodities have bene the go to asset class to play inflation as has been gold. However, gold has a new competitor for inflationary investments and that is crypto. This could be the cause for golds recent weakness. While Bitcoin is a complete supply and demand trade, I am not a believer in its ability to function as a financial currency because of its volatility. In terms of sectors, historically energy stocks than material stocks perform the best. Utilities and high yield stocks are the worse performing assets.
Feb 6th:
We got a weekly close at all time highs and would expect now one last big push higher that will take the S&P 500 blended model to 95. Remember this is where we want to reduce a significant amount of exposure. I don’t know the level on the S&P 500 but think a 88 to 95 will get us close to 4,000 on the S&P 500. Amazing 4,000 and last march we hit a low of 2,200.
Feb 2nd:
We are now once again attempting to retest the all time highs. As we stated previously, the NASDAQ futures would be bought off 1,2630 most likely. However, Sunday night they only reached 12,730 and bounced hard. Now the NASDAQ is only 90 points from their all time highs of 13,599 (futures). The only concern currently is the current reaction from earning beats, they have not been rewarded. But if we close above the highs on the index’s that won’t matter. As I have been saying, this bubble has a lot more to go before it pops.
Feb 1st:
Back on Jan 27th, we said once the insanity stabilized with this ridiculous REDDIT movement the broad market would find a bid. If you been watching closely, there is an inverse correlation to the decline of the most shorted names and the broad market rallying. We are not going to discuss again why this is as we already discussed this. The bottom-line, GME, BB, BBBY, AMC and the other most shorted names and even the new SLV short squeeze trade need to all crash back to their true intrinsic value for the markets to regain confidence. While this blip could cause a 5% to 10% pullback, this is certainly not what will cause the bubble to pop. And this is a bubble that will pop ultimate from rates. However, most likely this market is going much much higher, beyond levels of our imagination before significant pain is felt.
Jan 30th:
As I mentioned, the market destruction from these shorted names are effecting the market. I do not think this has caused the bubble to pop only rates or the deficit will be the cause.
Monday we either will get an up open that will be sold or a big cap down that will be bought. So I am looking for the NASDAQ to test 12,630 and the S&P 500 3,614. Worse case in my opinion will be NASDAQ 12,220 and S&P 500 3,500. However this is obvious just an opinion and not fact. Nothing fundamental, economical or on the rate side has changed. This is purely liquidation from weak longs. I think this bubble has more to go, but we will see!
Jan 27th:
I think we all agree the market sell off today is caused by a lack of confidence as a result of the most heavily shorted stocks like GME, AMC, BB, BBBY, SPCE. Additionally, pressure is coming from de-grossing hedge exposure from the hedge funds. When you are a hedge fund, they are running their portfolios as dollar or beta neutral. If you cover your shorts you need to sell your long as well to keep the portfolio’s exposure aligned. This causes hedge funds to sell their best winning positions and pressure unforced selling.
Do I think this massive bull run is over, no. Their is too much liquidity and PE multiple and other metrics will remain high. The Fed is backed into a corner and CANNOT back away from their easy policy or the markets will crash and the government will be crushed under their debt service.
I am not looking at levels, all I am looking at is GME, AMC, BB, BBBY SPCE to see these trades slow down in their moves. Once these names slow down maybe even reverse, I think the market will start to stabilize.
I will say, if the S&P 500 closes below 3700 on a Friday close, 3,605 is the next level. As for the NASDAQ if the NASDAQ closes below 12,950, 12,750 is the next level to watch.
Pre Market
We have not post in a while as the mana of the market has made commenting on risk is just a broken record. The Russell is now a -88 counter trend and the most most overbought ever since IWM was created. The market keeps rotating into on factor or sector or index and holds up as there is too much liquidity to take it down.
As for earnings it’s irrelevant that they are beating, they always beat the consensus on average. The real question is where should multiples be and at what point do rates change that. I have no other insight because the Russell is massively overbought and the NASDAQ and S&P 500 are just becoming overbought. I am cautious here!
Jan 5th:
We have a real catalyst today steaming from the Georgia election.
- The 10 year yield is breaking out above 1% because bonds are getting crushed as more spending is likely to increase the deficit.
- I think technology will correct even more as both higher corporate taxes and higher yields will pressure higher multiple stocks. I am avoiding buying the NASDAQ dip. I think if the NASDAQ closes below 12,390, you will see 12,000.
- The Russell is up 2.3% as inflation expectations are increasing from more government spending and higher yields and more government handouts. The Russell hit it all time high this morning.
- The industrials should continue of the back of this DEM win along with green associated energy, and financials on the break out of the 10 year yield. The 10 year yield needs to close above 1.02 for the financials to really get some momentum.
- Be sector specific if you feel compelled to buy.
Jan 4th:
Happy New Year! As we said on Dec 24th its time to take some profits on the Russell, however, its really time to take profits everywhere. The risk reward is not a good set up at these levels. The market is under pressure most likely as the Georgia senate race is underway and the DEMs are gaining ground. The market is certainty worried that if the Dems win spending will increase and their will be little balance of power. Either way, I am not a buyer at these levels.
Dec 24th:
As you know we have been very bullish on the Russell and since IWM moved to a Strong Buy its up 25%. Just to be cautious I would be slow reducing exposure to the Russell in case January sees some small cap selling.
Dec 21st:
The close:
The Russell is in beast bull mode, and after closing green today, it seems as though the Russell is not finished seeing new highs. I think today was a rather bullish day over all and if your looking for a reason to sell, this is not the catalyst. If I was a seller, it would be at higher levels into Dec 28th.
Premarket
For many investors waiting to sell into the COVID relief stimulus deal never got the chance. The S&P futures hit an all time high at the open on Sunday at 3,724 and rolled over to 3,600 before a small rally. The market is now on edge as there is a new mutation of Covid, however, it is unknown just yet if the vaccine will work on the newest mutation. Its anyone’s guess the out come, however, it is very logical for the market to pullback 2% to 3% as we sit at all time highs on new unknown concerns.
Lets see how the market closes before we panic.
Dec 17th:
We haven’t been posting because we have stated the markets will just continue to make new highs into year end. However, I am now posting because my opinion is once we get a deal the market will rally significantly the first hour and the news will be sold for a reversal. The market has now built in the news and unless the deal turns out to be bigger the market will not go higher.
I do expect all the shorter term traders who are getting long for a year end rally to unwind their longs in January. I do expect to see a nice 5% to 10% pullback mid to late January at which point will be a decent entry to get long once again. Valuations are getting absolutely insane at this point, but none of that matters any more as long as rates stay where they are.
As the usual, expect the “January Effect” to take place. Expect the worst performing stocks and sectors of December to rally in January and what worked best in December to be sold.
Dec 4th:
Technology: As I mentioned several weeks ago, watch out if the 10 year yield breaks out around the 1.01% level. Quants will sell bonds and high multiple stocks triggers a valuation readjustment and will buy small caps as a reinflation trade.
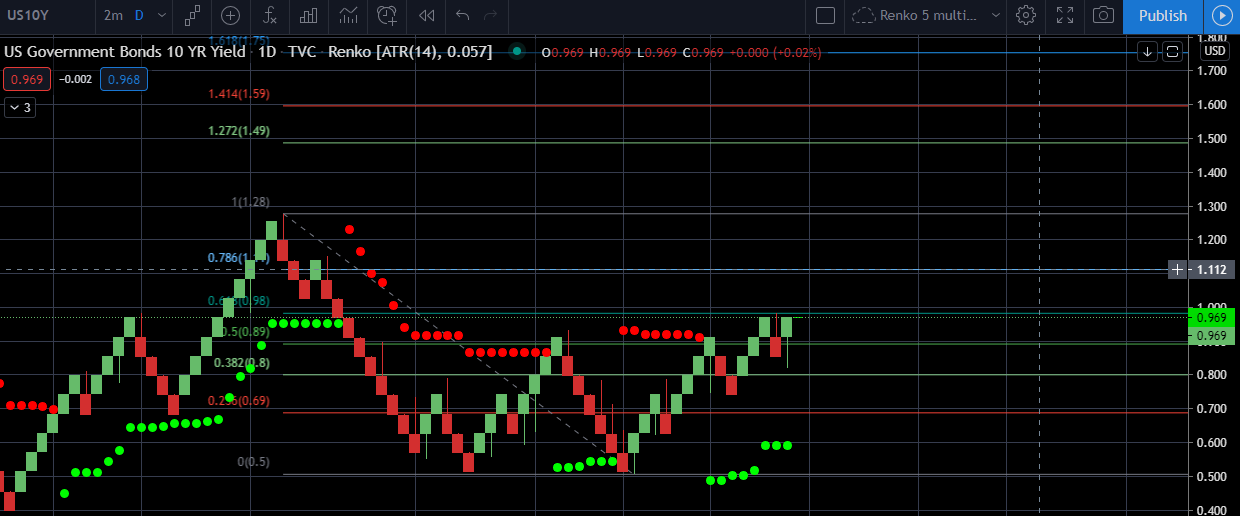
Nov 24th:
My view has not changed since Nov 16th. We last stated the Russell and S&P 500 will continue to make highs into year end while technology will be weak. I think technology will still continue to lag as the rotation I discussed with the Russell, Consumer Cyclicals, Industrials and Materials is real “for now”. It will end like all trends, but there is more gas in the tank. I am also still holding onto the theory Q1 2021 could trigger a high multiple sell off with the 10 year yield close above 1%. Although, the 10 year has rejected 1% now sitting at .86%, we will be watching.
Nov 16th:
Very tough market to get long at this juncture and its understandable when major banks come like Bank of America is saying sell the vaccine news last Friday. On Nov 11th I said that the S&P 500 and Russell would continue to new highs into year end. Although, I do have my reservations about the NASDAQ. Once again the NASDAQ underperformed as the rotation trade was sparked further by Moderna’s data of their 95% success rate on their trial vaccine.
The S&P nor the Russell are overbought and while COVID19 is getting worse, I don’t think the market cares one bit now that we have two viable vaccines that will be available within the next 3 to 5 months on a wide scale. I am not even sure the market cares about another stimulus plan. To be honest, the market is way overvalued and has been for months and non of this matters as long as rates remain low. I would have expected rates across the curve today to increase.
Nov 11th:
As we stated yesterday the selling started to slow down into yesterday close on the NASDAQ. Although, we never got that pullback in the NASDAQ for a bounce to add to some of our favorite tech names. One cavate was the bond market was closed today, so there was a big head wind removed from higher multiple stocks allowing them to move higher.
What are the risks now in the market? I don’t see many except if rates break out higher. Higher rates equals lower multiples on growth stocks its that simple. I do see the S&P 500 and Russell making new highs into year end. I still remains cautious that tech or the NASDAQ will break out to new highs and will keep trading within this 1,000 point range.
Nov 10th:
We hope every who wanted to had the opportunity to reduce some technology exposure when the NASDAQ was up 1% to 2%. While on the surface, the S&P 500 and Russell looked constructive, momentum just had its biggest crash on record. However, selling did seem to slow down into the close.
I think if the NASDAQ can open down at 11,347 (futures) & 11,295 (cash) its time to pick up some of your favorite names. I will say if the NASDAQ fails to hold this BIG level, the index will most likely retest once again 10,750.
This was a massive catalyst (vaccine) so I expect the Russell, industrials and materials to have more room to run.
Nov 9th:
Mid Day
Rates are jumping massively, risk on but also the market is going to price in less QE balance sheet expansion. You know higher rates will cause the technology sector some pain. We broke out to a new 6 month highs and next stop is .99% on the 10% year. Let’s hope we get a bigger rally in tech later today to reduce exposure.
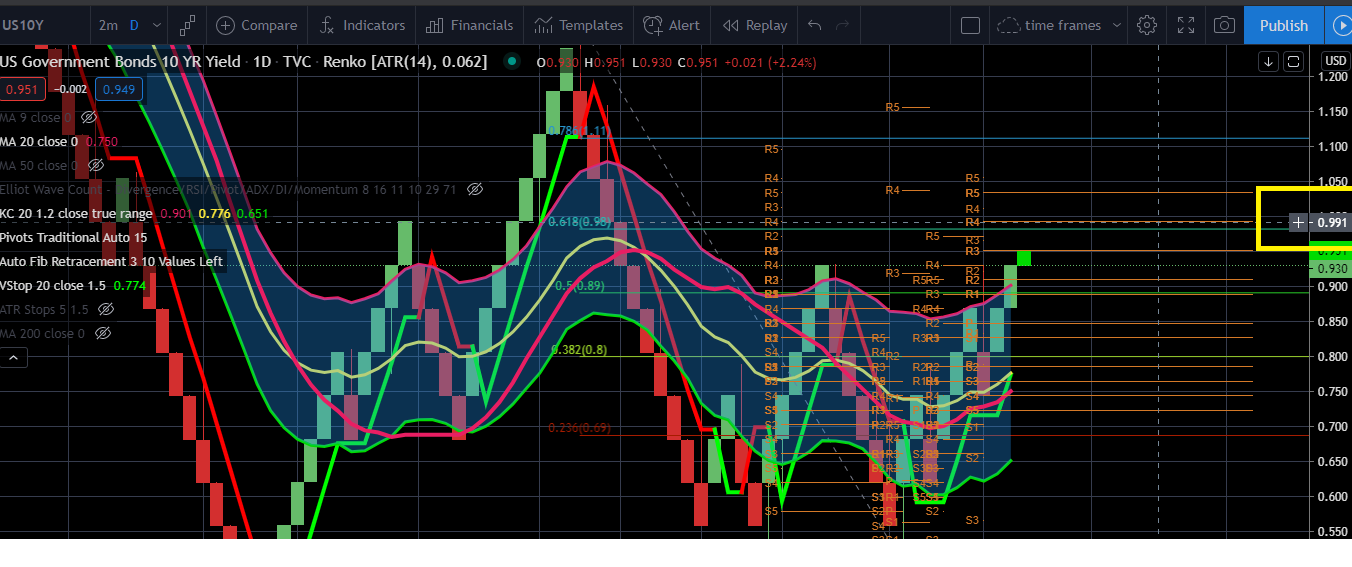
Pre Market
With the big news out this morning the only game changer I would be looking at is what we discussed several times that if there is a vaccine, technology will come under pressure. If we can get the NASDAQ up more than the open, 1% to 2% raise cash in tech. That capital should be redeployed to Cyclicals, Russell, S&P 500, Industrials, Materials, not buying tech. I would not be buying anything today anyway, just reducing tech on any rally throughout the day.
Nov 8th:
Well what can we say, if you asked, almost no asset class played out based on the developments that have transpired, the dollar, not bonds or equities. The Russell futures tonight hit a new high, however, small and mid and even consumer cyclicals have lagged this past week. The NASDAQ futures are trading at 12,325 and now only 140 points from the all time highs. As for the S&P 500 we are trading at 3,553 in reach of the all time highs of 3,587.
Semiconductors are lead the tech run here with very very strong earnings this season, which was caused by more stay at home workers and the need for computing power.
Now the question is any cash on hand do investors deploy it? I truly don’t have the answer as this juncture, but if we close above the all time highs, especially on a weakly basis, we are going much higher. While I have been saying for months we would see the old highs by year end and possibly new highs, I did think the pull back would have been bigger during the election transition.
Nov 4th:
- Happy election! As of this morning we are looking at a 66% portability of a Biden win. But this is not the bigger story, the Red wave in the Senate is giving the NASDAQ/Tech a boost, while the Russell small caps, industrials and materials basically flat to down.
Today is not a day to be rebalance or trading until se get more clarity. I currently have no set up with the current information that is available. If that changes, I will be back.
Oct 30th:
Today’s terrible NASDAQ price action in my opinion was strictly a result of investors selling their biggest winners before a likely Biden win. If I am not mistaken, Biden is looking to take the current capital gains rate to an ordinary income rate. That is massive. Additionally, industrials performed the best by a wide margin today. As we have stated Biden is looking for $2 trillion in infrastructure spending.
We did say we thought 3,250 on the S&P 500 was our base case target. However, I think next week is going to cause real havoc on the market unless Trump wins in a landslide. I am removing my contested election target of 3,150. I think with a contest election the index will breach 3,000. However, I am not yet going to put a target level on a contested election outcome, where the true count wont be figured out for a few weeks. This is the worst case scenario.
A clear Trump win, just get long QQQ and ride it back to 12,400 on the NASDAQ. However, from the current polling “which is garbage anyway”, has a Biden 7 point lead.
Oct 29th:
After hours was not pretty, except for Google, everyone’s favorite stock Apple reported and iphone sales came in light especially with China being the culprit of weakness. AMZON which actually came in better than the average analyst expectations just couldn’t come in high enough on the top line growth.
More importantly, this has the NASDAQ futures trading 60 points from yesterdays lows and that is somewhat concerning depending on your objective. We take out the NASDAQ 11,120 lows of yesterday, next stop is most likely 10,750. As for the S&P 500 futures they are trading at 3,270 and it really needs to hold 3,250 or we will see 3,200 tomorrow.
I think we have said we have been cautiously waiting to redeploy fresh capital. I know many have been waiting patiently and want to play this safe next week with the election. There major risk is a contest election, and if so we will see 3,000 no problem on the S&P 500. However, if Trump wins its going to be a rally of rally’s.
Lets just see what happens before getting overzealous to buy.
Oct 28th:
Today was brutal, but orderly. We said that 3,250 and 10,750 respectfully on the S&P 500 and NASDAQ seemed likely at this juncture. The catalysts were really a lock down of Germany of France. I also believe short term investors are repositioning risk for next weeks election.
Tomorrow would not be unusual to see a up opening that is sold off. This is a game I am not will to playing either way. I think if we can get a large flush out tomorrow 3,200 maybe even 3,150 the S&P 500 and 11,000 to 10,750 on the NASDAQ some nibbling would be constructive. However, next week presents significant risk post election, so keep your allocations light.
Oct 26th:
Nothing has changed since Oct 19th. Weakness across all index’s today especially small and mid caps. Between a lack of any progress/chance of a deal over the weekend and Covid cases picking up momentum and the election next week, the VIX popped 17%.
On Oct 19th we listed 1 of 3 possible outcomes, outcome 2 seems likely now. However, I was encouraged that the NASDAQ (futures) 11,330 NASDAQ (cash) held 11,280. If we close below these levels, it seems case 2 below would be likely.
- No deal pre election: The index’s could level out at 3,250 S&P and 10,750 (NASDAQ -Cash). These levels might be a very constructive areas to start allocating capital.
Election: Lets have some fun, however, this is unquantifiable election outcomes:
- Contested election I believe 3,050 will be achieved, and a good place to start to get constructive.
- Biden win, 3,150 and will be a opportunity to get long. Why?.. as we mentioned previously the S&P 500 will shave $10 off earnings that will be 200 S&P points according to Goldman. However, Biden is on record as of Oct 26th saying the first piece of business is to pass $2 trillion in stimulus (infrastructure). Industrials and materials will see inflows.
- Trump win, get long QQQ and technology market will break out to new all time highs.
However, this is group think (large majority of market pundit), everyone is thinking the same thing which scares me. Or it becomes a self-fulfilling prophecy.
Oct 22nd:
Nothing has changed from my last view point on the 19th. In my opinion technology will continue to underperform for two reasons in the near term.
a. Yields are moving higher and putting pressure on higher multiple stocks. 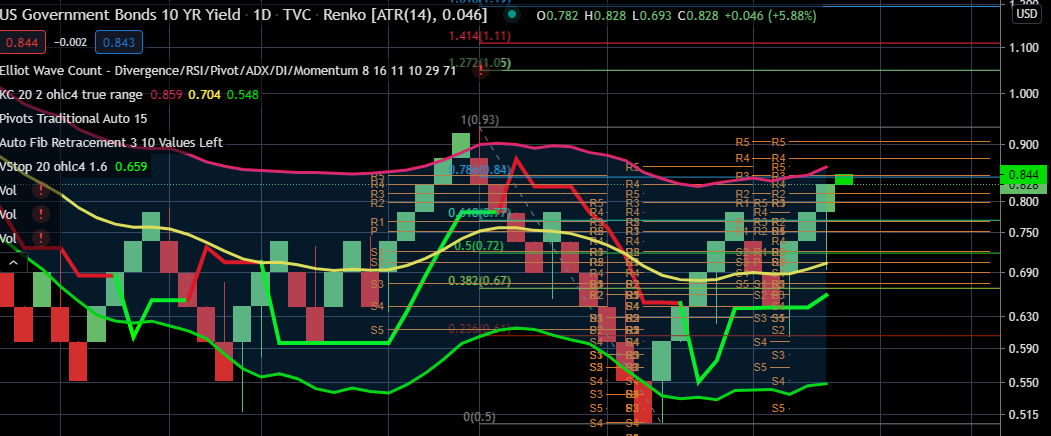
b. Biden’s potential win is causing investors to sell their biggest winners before a potential new cap gains rate increases. While this is premature, the market is always forward looking. By the time it goes into effect it will be time to get long these names again.
Oct 19th:
More of the same political nonsense, these politicians are truly a special breed of human. I still believe regardless of the political games a deal has to get done after the election. If not, the small business owner and the 14/15 million unemployed are going to be in serious trouble. Meanwhile, we did say we could easy test 11,600 (NASDAQ Futures) on Oct 15th, today we hit a low of 11,591.25. I would like to see this hold.
I still hold on to the notion that the historical highs will be retested after the election. Valuations just are irrelevant (of course until they aren’t) with so much monetary and fiscal stimulus. For those investors still waiting on the sidelines with higher levels of cash. Hopefully there will be one more large downside provided before the election for a year end rally.
The question is how much further down is a good entry for both the S&P 500 and NASDAQ. Unfortunately, we won’t know until after a deal or post election after the fact. A break below 3,400 on the S&P 500 will challenge the 3,300 level and for the NASDAQ (cash) a close below 11,290 will see a retest of 10,900.
The BIG BINARY IF: There is no way to forecast the out come of this deal!
- A deal closes pre election: We retest the old highs on the indexes. Might be hard to get in already at this point.
- No deal pre election: The index’s could level out at 3,250 S&P and 10,750 (NASDAQ -Cash). These levels might be a very constructive areas to start allocating capital.
- For very long term investors: Who are very conservative, 3,160 is a massive level. I am not saying we get there, however, with any post contentious election results its a possibility. I would certainly find this level to be interesting for longer term investors who want to get long. This is the weekly chart below.
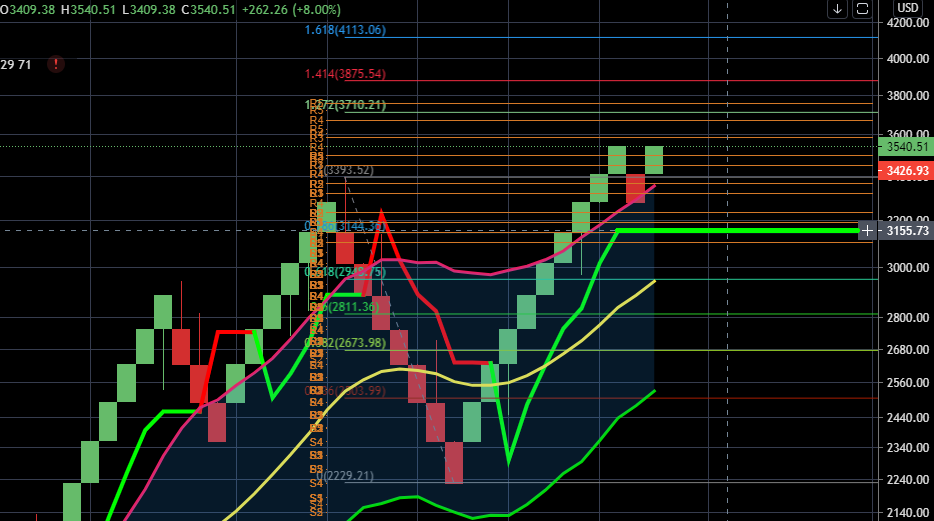
Oct 15th:
Not much to update besides the obvious. Yesterday morning the NASDAQ was under pressure prior to Secretary Munchin’s comments of a stimulus deal not likely prior to YEAR END. I think Mondays so called Gamma squeeze break out of 11,600 on the futures could be easily retested. Today you have Goldman Sachs downgrade Technology to neutral for a number of economic and political factors which is causing some additional pressure.
At this juncture I am neither bullish or bearish, however, I still think there is a good chance both index’s will retest their all time highs after the election. I still think the Russell and consumer Cyclicals will see a nice flow over the next several months. Especially if a Democratic win. If Trump wins, technology will be the place to be once again.
Oct 12th:
I have been saying it for a while now, the market has really become a joke and at the same time I don’t think it has every traded more on price series and patterns than ever before, while fundamentals are totally disregarded. I really hate a market that goes up exponentially on multiple expansion with little earnings growth. Even technology that is seeing earnings growth is trading way beyond many of the names historical multiples. Therefor as long as you can do a decent job with a trend following approach, who needs fundamentals?
- Today the NASDAQ rallied purely on the fact the index on a weekly closed above 11,600. We been discussing this level for weeks as a line in the sand and if the index did close above it, 12,000 (futures) seemed very likely. However, I didn’t expect to see 12,197 today!
- So now the question is do we retrace todays gains tomorrow and give back what we gained today. Very possible, but I think at this juncture, the index’s are too close, not to test the all time NASDAQ futures high of 12,465 and S&P 500 futures 3,586.
- Until we get to the the all time highs I won’t really know if anything should be taken off the table. As I was kidding on Friday, why should this market just trade at 30 times earnings, does it even matter anymore? The truth is the market will go higher with a Trump or Biden win it doesn’t matter. Biden will raises corporate taxes taking down the earning EPS from $180 to $170 based on Goldman Sachs analysis. However, Biden will potentially add another $7 trillion in stimulus, totally neutralizing higher rates. Not sure where Goldman gets the $7 trillion, but I will take their word for it. If Trump wins, the market gets low corporate taxes and the song remains the same.
Oct 9th:
Summery of what we have been saying:
- Since Sept 21st when the NASDAQ futures tested 10,650 we said it was likely that the index would see a full counter trend rally back to 11,600. We did say we wanted to reduce tech at 11,600. However, we did say a close above 11,600 especially on a Friday close (like today) we could see a a push to 12,000 Futures). Today we close above 11,600 at 11,720, recall we said an intra day overshoot of 11,720 was likely. In my opinion, tech caught a strong bid more so than the Russell or S&P 500 when Fed President Evans said, the Fed will do more QE if the economic recover stalls. As we know, the biggest benefactor of QE is high multiple stocks / Tech.
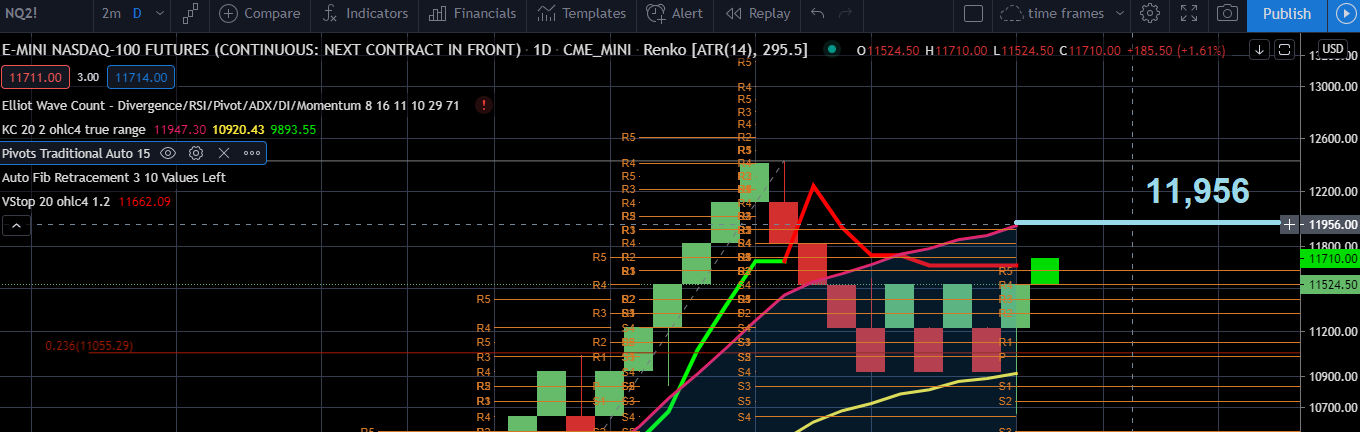
2. The S&P 500, we were looking for 3,440. Today we closed at 3,477. At this point, a retest of the highs of 3,600 seems likely as a systems are building strength coupled with a larger stimulus deal and even more QE as discussed if needed. We discussed last week however, is it worth deploying fresh cash to chase the old highs of another 4% is only a question you can answer
3. We also said a Covid relief deal not getting done was all noise and a low probability of not getting done and felt the market had a backstop. It was rather transparent Trump would want to get something done. As of today, he now wants a bigger deal!
4. The fundamentals make no difference at this juncture, the Fed will do more QE and Trump wants even more stimulus than the previous $2.5 trillion the Dems wanted. If Trump isn’t elected a deal will still be completed. Why cant the S&P trade a 30 times 2021 earnings at this point. While I am kidding partially, why not which would be 5,000 with Goldman’s estimated $170 per share on the S&P.
What are truly the risks now with this artificially stimulus /QE cracked out market. Higher corporate taxes, already built in and will be a welcomed buy the dip if Bidden wins. Higher rates? Doubt they will move much higher with continued Fed QE talks.
At this point I really don’t see why the indexes wont see new highs before year end regardless how Q4 earnings look. The quants who trade on price series and pattern recognition are in charge and they can careless about valuations. Let the fundamental analysts think they do and keep trying to justify why multiples keep expanding.
Oct 8th:
Today we are going to possibly test 11,600 on the NASDAQ futures and 11,400 cash. We have been saying we want to reduce exposure to tech at this level. While fundamentally, the markets are overvalued, the question is do you keep dancing until the music stops. If the NASDAQ tomorrow on Friday closes above 11,600, the NASDAQ most likely will push to at least 12,000 (futures). S&P 500 (futures) closes Friday above 3,455 and a retest of the old highs seems very probable. Its a tough and personal investment decision based on your risk tolerance at this point to stay long or reduce risk. But as we mentioned last week, it was extremely bullish that the index’s were so overbought and the reverted back up very strongly.
Oct 6th: Note: Russell
Typical Trump “art of the deal” move, holding out for post election. Pick your reason, Supreme Court seat, state funding not willing to work on or political ploy as he is lagging in the polls. I really don’t care the reason as much as I believe a deal will get done regardless after the election. The question is can the market tread water at these levels until after the election?
If the market didn’t think a deal was going to get done the S&P 500 would have been down 150 or 3% today. I think the S&P 500 will be bought into 3,250 and if the NASDAQ futures got down to 10,650 that will be bought as well. But after today’s price action, I don’t think we will get that low.
Note: I think the Russell (IWM) and small caps (VB) are on the verge of a big breakout. Can this really be the case after so many failed attempts after 10 years of underperformance. I think with new stimulus and a vaccine 12 months out this will be an area capital will flow.
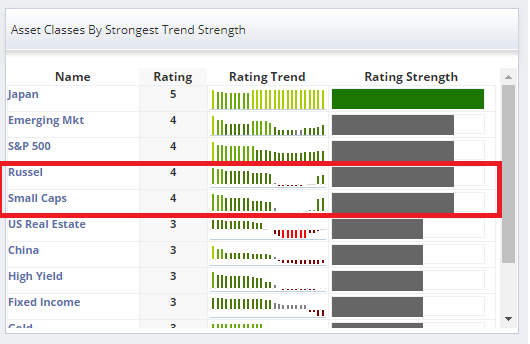
Very little to report today. As I mentioned on Sunday, Fridays sell off was not a significantly negative event in my opinion. Where do I stand now with the markets? The markets are solely being driven by Fed and Government stimulus. With new government stimulus likely, I don’t see much downside prior to the election. The fact that the S&P 500 model was so overbought and could breakdown further was very bullish.
As earnings come in they will be an easy beat in my opinion and when you have multiple expansion, it really doesn’t matter anyway. Valuation will remain elevated until the Fed pulls the plug or yields make a bullish breakout and causes some panic. As seen below, I believe once the year yield closes above .89 level, high multiple tech stocks will see some panic selling. As we know higher yield are kryptonite for high growth high multiple tech when you have massive multiple expansion. Granted many tech names are seeing significant top line revenue group. However, multiples will contract regardless with higher rates. A Game changer for Tech will be a weekly close above 1.267 on the ten year, which I don’t expect. So the initial sell off from the rise of the 10 year to .89 will most likely be a good buying opportunity.
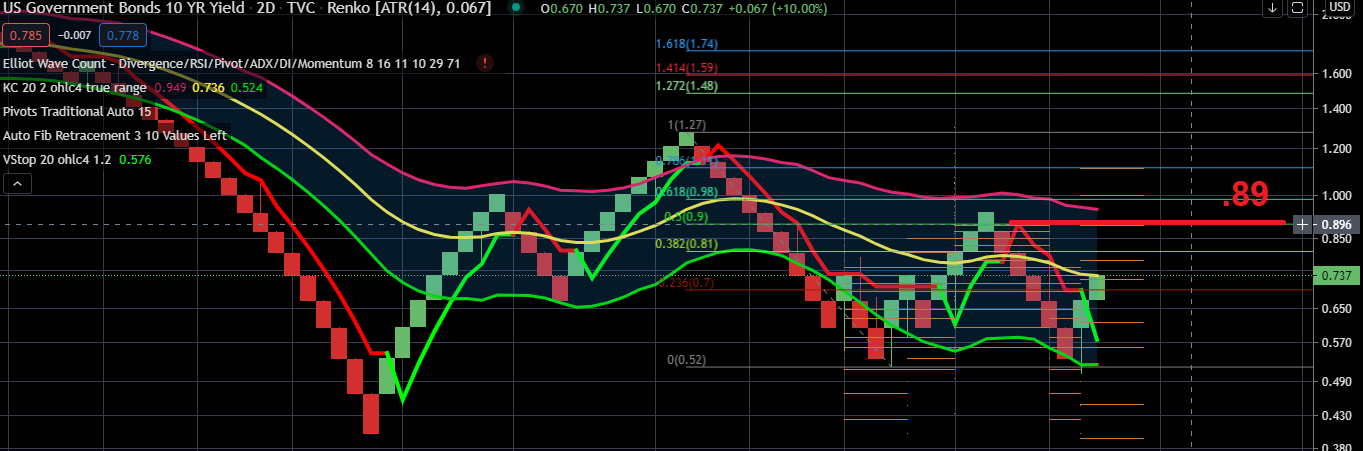
Oct 4th:
Very little to report from Oct 1st. Everyone reading the commentary had ample time to reduce some equity exposure as both the S&P 500 and NASDAQ essentially hit out price targets.
In terms of a market catalyst for a sell off, I do not feel that President Trumps hospitalization from COVID has any real long term impact on stock prices. However, I am not going to handicap where markets trade based on this event. I still think markets have a backstop with a fiscal stimulus package that is now more likely than on Thursday before Trump’s diagnose and sliding in the polls. I think this will cause Trump and the GOP to come to the table and possibly get a deal done that is even larger.
Oct 1st:
As previously thought the NASDAQ futures did hit 11,599. I do think this level is an area to reduce risk within Tech. However, I would expect this level to be tested and challenged and even possibly overshoot to 11,740 as I discussed previously. It’s a complete step function on levels. First HFT’s take up extremely short term levels, then drawing in medium frequency systems then long term trend followers, hence the reason for massive price expansion and multiple expansion. A close above 11,600 will bring in system traders causing additional buyers and even short covering.
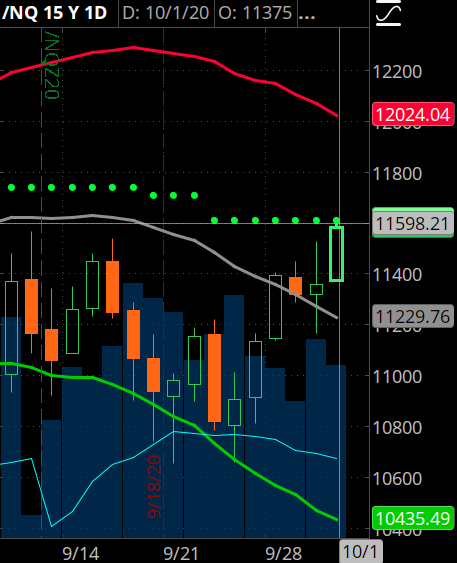
Today we saw almost a 341 point reversal in the NASDAQ from the overnight lows. I think regardless of the Presidential election, the markets will have an upward “FED” bias. Its too easy to think higher corporate taxes will reset high growth multiples.
The catalyst for this reversal today was more stimulus talks. I believe this was well anticipated and largely priced in as Fed Chair Powell has been voicing his opinion for more government stimulus.
Since Sept 21st we said 11,600 would complete this small counter trend rally. Again, I don’t care the cause/catalyst, there is always a catalyst for a melt up or correction. The set up was a self-fulfilling prophecy (see below for explanation) for 11,600 & 11,420 respectively (future and cash levels). Even though we only hit 11,525 (futures) & 11,280 (cash) index today. We did see some selling pressure into the close as Senator McConnell said the GOP was far way from reaching a deal. However, if market participants truly believed the risk of a no deal vote was a high probability, we would have seen the over night lows into the close of 11,180.
If you asked me to put a probability on a deal prior to the passing of RBG, I would have said 100% probability of a compromise on a deal. However, stimulus now in my opinion, rests on egos of filling this Supreme Court seat and the Trump administration has the upper hand which significantly lowers the odds for a prolonged outcome and more volatility.
Again to reiterate, nothing has change in my opinion for both the NASDAQ and S&P 500 targets on the very short term.
- NASDAQ futures 11,600
- NASDAQ cash 11,420
- S&P 500 futures 3,400
- S&P 500 cash 3,440
- I would be reducing long exposure at these levels.
Explanation on Self-Fulfilling Prophecy: Above we discuss why the 11,600 price level was a Self-fulfilling target/prophecy. This is really a function of what is a common practice in the High Frequency Trading (HFT) world called “Momentum Ignition” Typically HFT’s will try to move the price of an index via futures or a well covered momentum stock to trigger a Buy stop or a sell stop. Once a buy stop or sell stop is triggered short term traders will either cover a short or go long. So what exactly constitutes a buy stop or sell stop? Typically, quants will use some function of a Volatility stop or ATR Stop that we have discussed on a very short frequency time frame ranging from a 2, 5, 15 and 30 minute time frame for this ignition.
These HFT’s will sell or cover a short once the initial buy stop or sell stop is triggered. However, this also causes a chain reaction from medium than longer frequency trend followers who use 1,4 hour and 1 day and 1 week ATR and Volatility Stops.
I point this out as I believe its important to understand why the markets react and move the way they do. What I like to do is watch any market from a 2, 5, 15, 30 minute and 1 and 4 hour and 1 day RENKO with a ATR stop overlay to get better insight to all quant frequencies.
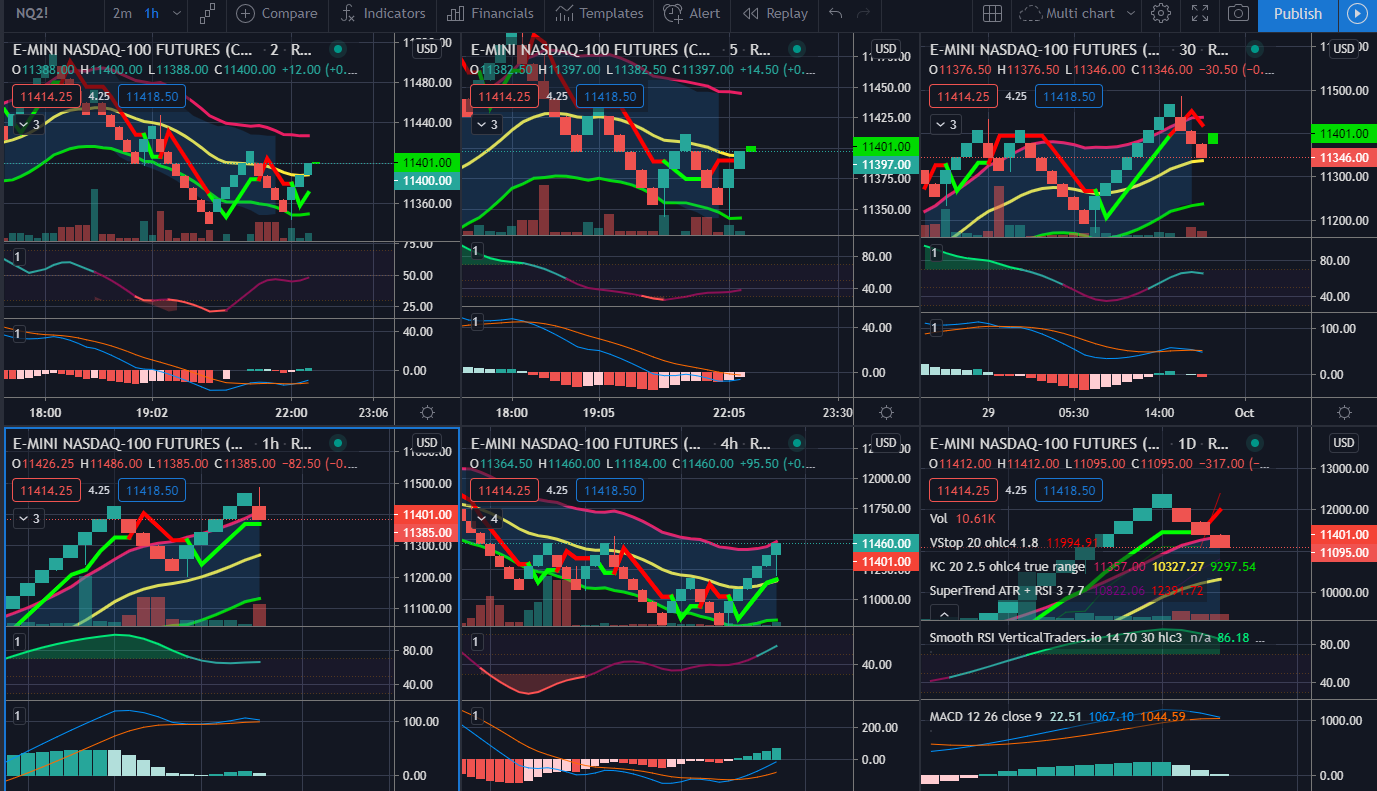
Sept 28th:
Today will be an IMPORTANT tell for the NASDAQ. If the NASDAQ can hold the current gains and the 11,280 level (futures). More importantly, a close above 11,360 on the NASDAQ (futures) will be extremely short term bullish. I would than anticipate a complete counter trend rally we have discussed for the last week or so to 11,600 and even possibly 11,750. If today’s gains are rejected and the NASDAQ closes red, the index will have serious issues and a retest of 10,650 would be in the cards. As for the S&P 500, the rotation is widening out and I am less concerned with the S&P 500 downside risk.
Let me iterate, I would still use all rallies to reduce long technology equity exposure. 11,600 would be the level I would reduce technology and 3,400 would be the level for all other S&P 500 sectors.
Once Additional note: the S&P 500 Strong Buy to Strong Sell ratio just crossed and is now signaling a negative divergence.
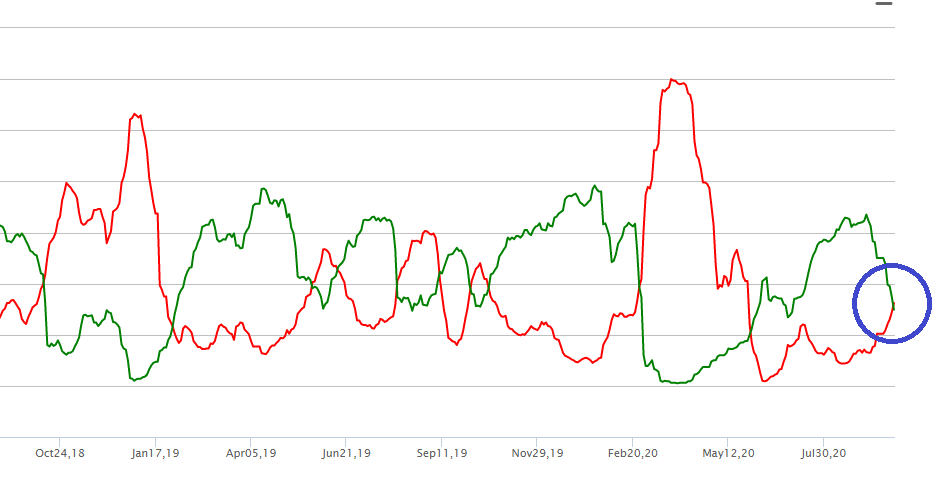
Sept 25th:
The Close:
Today’s market rally was lead by options expiration and system traders (quants). Today felt very similar to prior melt ups that lacked the participation of discretionary investors.
The “Machines” were well bid after the NASDAQ failed several times to break below 10,830. Once the NASDAQ failed to break below 10,830, this caused short term systems to cover their shorts. Remember, behind every quant there is a programmer and these programmers who are using short to medium frequency signals are only looking at 1 thing… price and not fundamentals.
- To reiterate, a counter trend rally back to 11,550/11,600 (Futures) & 11,250 (Cash) on the NASDAQ would not be unusual and very achievable. This is the level where system traders started to derisk. A close above is were quants will start to cover shorts and ad to risk assets. I am still a seller at these levels as the risk/reward is not warranted.
- Note on 10,600 level: While I am a seller into the 11,600 level, please be objective, the NASDAQ could overshoot on the up side to 11,750. The reason is for 2 consecutive weekly closes the NASDAQ held the 10,650 level and bounced significantly. 11,750 would be a measure move (Fib Retracement) from 10,650 for a complete counter trend rally to be complete. Remember 10,633 was a significant support level. I like the Volatility stops on the indexes because many large quant (system developers) use these basic price signals to delever their portfolios or increase risk.
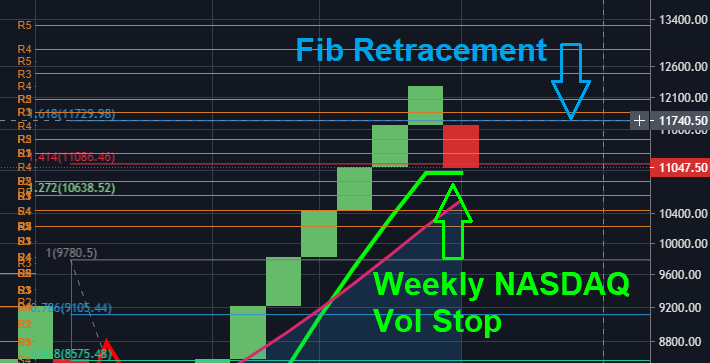
Morning:
No Change in outlook:
We are seeing a continued work off on the excess overbought condition of both the NASDAQ and S&P 500. Two reasons I believe we are not seeing a faster unwind of both the models and market decline is the following: 1.) Investors had ample time to hedge portfolios as the pullback was not caused by a specific catalyst. This is allowing investors the luxury for greater downside. 2.) Because the models and market were so over bought, investors are conditioned to buy any pullbacks. Typically, working off this level on the models take more than just a few weeks.
Below I am looking at the number of Strong buys vs. the number of Strong Sells for the S&P 500. This is a very robust measurement of the breadth of the S&P. I am currently watch to see if the Strong Sells cross above the Strong Buys. When this occurs this is a risk off signal.
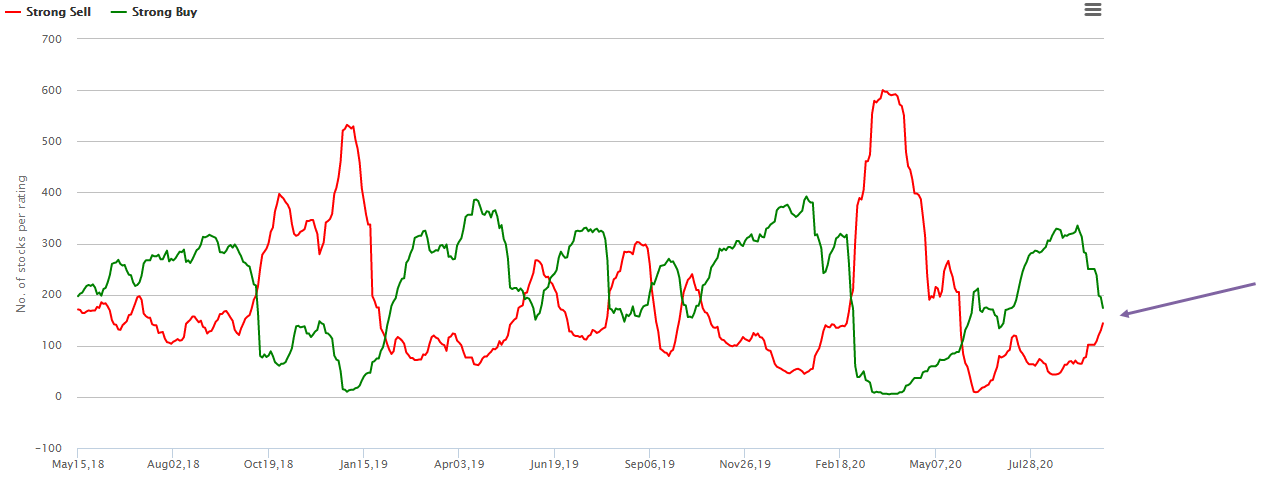
Sept 23rd:
- I believe our conviction has been steadfast with reducing technology and not redeploying fresh capital into equities since we hit the 95 on the S&P 500 model on Sept 2/3rd.
- Since Sept 3rd we have said the NASDAQ was likely to trade to 10,600 and a close below this level will put the 10,000 level into play. To be more precise, 10,350 on the futures and 10,250.
- I really don’t want to discuss levels just yet, until the excess has been worked off on the indexes.
- To reiterate the blended S&P 500 model needs to get close to 0 for the excess to be worked off. At 0 we are not even oversold. Remember, a reading from 95 reverts to 0 more than 60% of the time.
- When momentum crashes its very difficult for the models (rating value & counter trend) below to build back up strength when reverting from such strong reading.
- As for the QQQ’s, the counter trend measuring exhaustion hit a significantly overbought -85 on Sept 3rd. Today the counter trend is around -44 considerably less overbought. However, 60% of the time from less than -80 a reversion will get close to 0. So in this case I believe the NASDAQ as well as the S&P 500 will continue to see selling pressure.
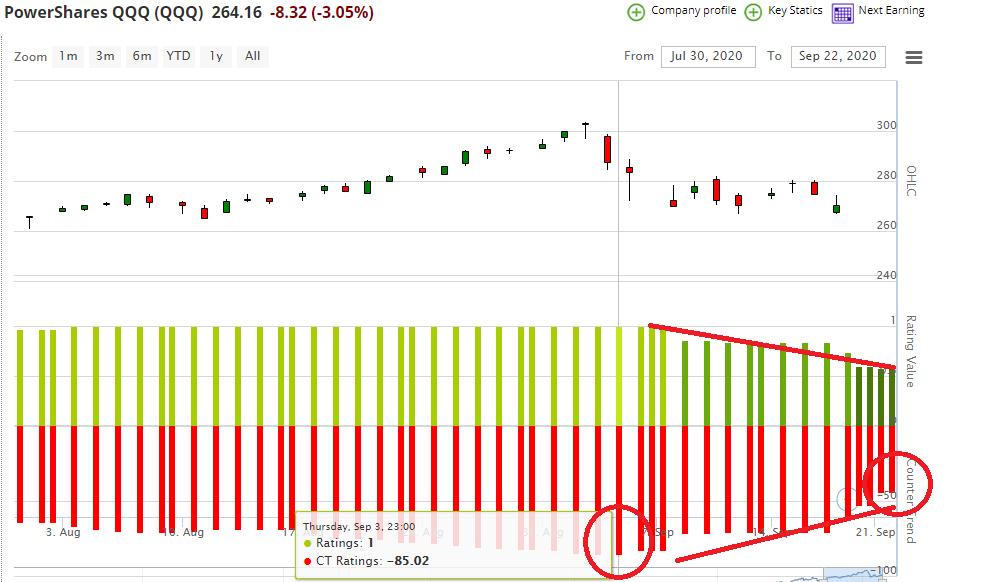
Sept 22nd:
- Rather typical move today after yesterdays positive reversal. As we mentioned yesterday, yesterday’s close would help bring in buyers today into the NASDAQ.
- Additionally, as we mentioned yesterday, a counter trend rally to 11,550 (NASDAQ futures) would not be out of the context of a measured move. The index needs to close above 11,600 (futures) & 11,420 (cash), especially on a weekly (Friday) close to draw in system traders for a move much higher.
- I would be using days like today at the close to reduce tech exposure.
- AMZN was up 5.69% off the back of a Bernstein upgrade and Apple held its morning gains after dipping into the red. However, besides GOOG, MSFT and FB, semis remained weak in my opinion.
- One signal I look at closely is the Semi’s vs utilities or treasuries relationship during market peaks and troughs. As seen in the chart below, utilities relative trend strength is increasing vs. semis (long utilities short Semis – not a trade recommendation). This is not the most bullish scenario for risk assets and economic expansion. Granted this might be more of a rotation into the election, however, these trends do lend some insight.
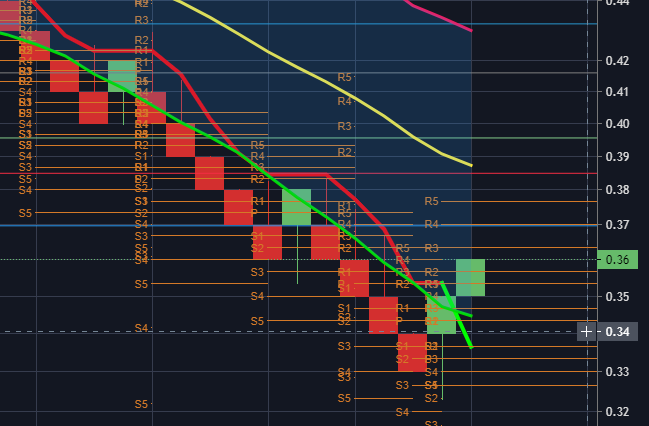
Sept 21st:
Was that it for the Tech sell off? 10,900 has been a formidable level for the bears. The NASDAQ futures once again closed above 10,900 at 10,960. This should help some continued buying tomorrow as the 10,600 level was rejected on the downside to close above 10,900. As we have been saying, watch for 10,600 on the futures, to be exact 10,633 (as seen in the chart from Sept 17th). The low for the NASDAQ futures today was 10,653 and 10,519 for the cash index.
I think in the short term we can get a small counter trend rally, but until we close back above 11,550 futures (see first chart) and 11,400 in the cash index, trend following quants will not increase long exposure in a significant way. I would still use 11,550 if we reach that level to reduce exposure. I still think more of the excess in both the S&P and NASDAQ have to come off measured by our models.
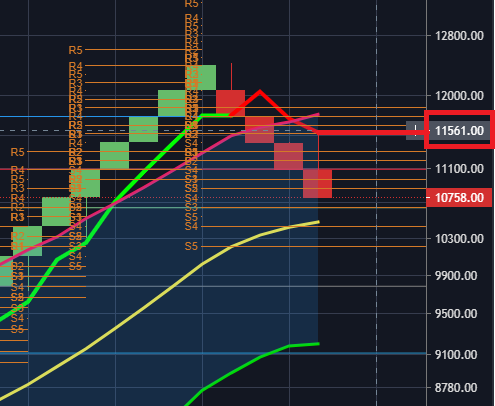
Because Apple was the key reversal factor that lead the NASDAQ rally today, it will be important to see if Apple can can close above its significant level of $114.
I personally do not think AAPL has seen the low just yet based upon the counter CT (counter trend) in red below. Historically over the past 40 years, the CT will not regain significant momentum when it increases from a -86 to a -40, the momentum continues to erode. Thus sending the model to at least a 0 reading.
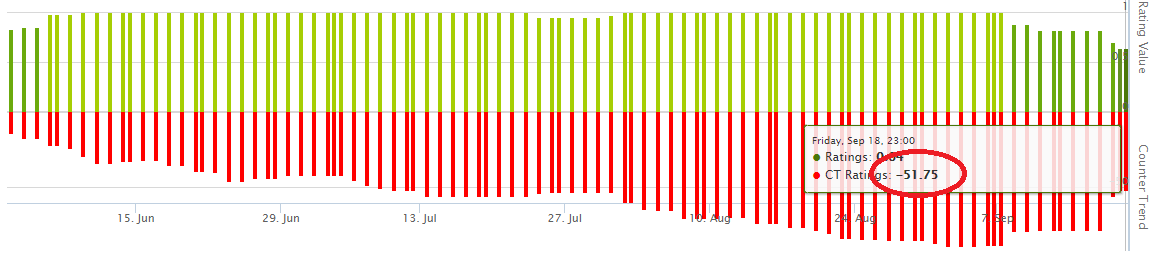
As for the S&P 500 futures, we held a critical level of 3,225. A close below 3,225 would bring in the 3,150 level into play. The S&P 500 model as of Friday was 58, maybe after today it will be 40, we will see tomorrow. As I have said previously, almost all cases were the reading failed from a 95 reverted to 0. I still believe this to be the case. So I do not believe today was a buying opportunity for the S&P 500 and await for greater opportunity.
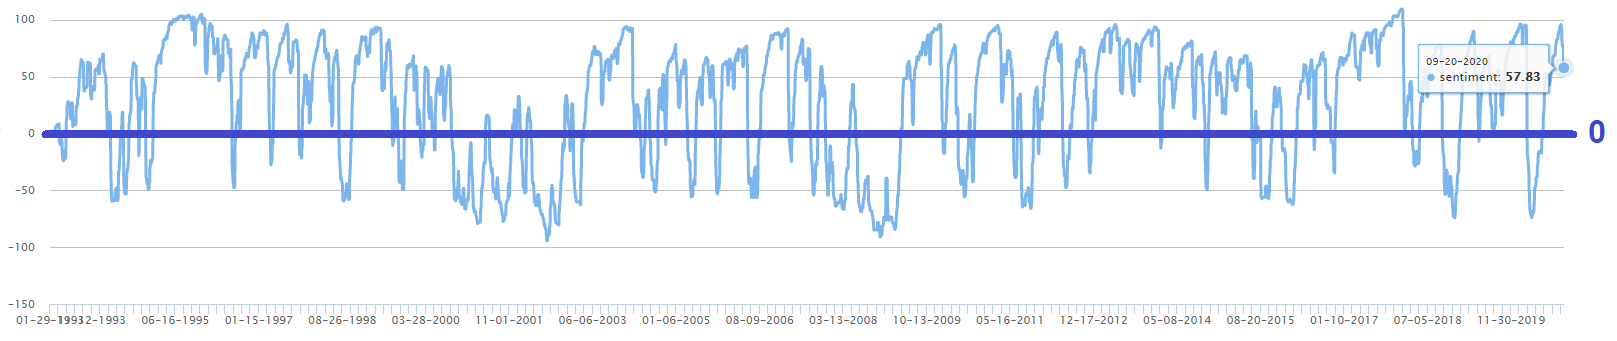
Sept 18th:
Well so much for holding yesterdays 10,900 level. Unless we are day trading, today really shouldn’t have come into play for most of you. We will need to see the close today, however, once again I see 10,600 on the NASDAQ futures.
Below I want to discuss how I am interpreting the counter trend, in this example its for the QQQ’s. Remember the counter trend is measuring the overbought condition and the more negative the reading the more overbought.
- -49 is approaching overbought,
- -69 is overbought
- -85 is extremely overbought.
Typically, I do not sell a security unless it extremely overbought or the counter trend starts to become more positive indicating sellers are coming into the market. This counter trend model provides a great longer term more robust solution than off the shelf indicators like RSI or looking at standard deviation on a moving average.
Example: QQQ
- Chart 1: Back in March of 2020 the QQQ saw a massively overbought counter trend at -86, it ultimately reverting to 0 and ultimately oversold with a +20.
- Chart 2: Back on September 2nd of 2020 the QQQ saw a massively overbought counter trend at -85, it is only a -64 currently. If history is statistically relevant, the model could see 0 before the excess of the NASDAQ is fully removed. This means potentially another 5% to 7% lower.
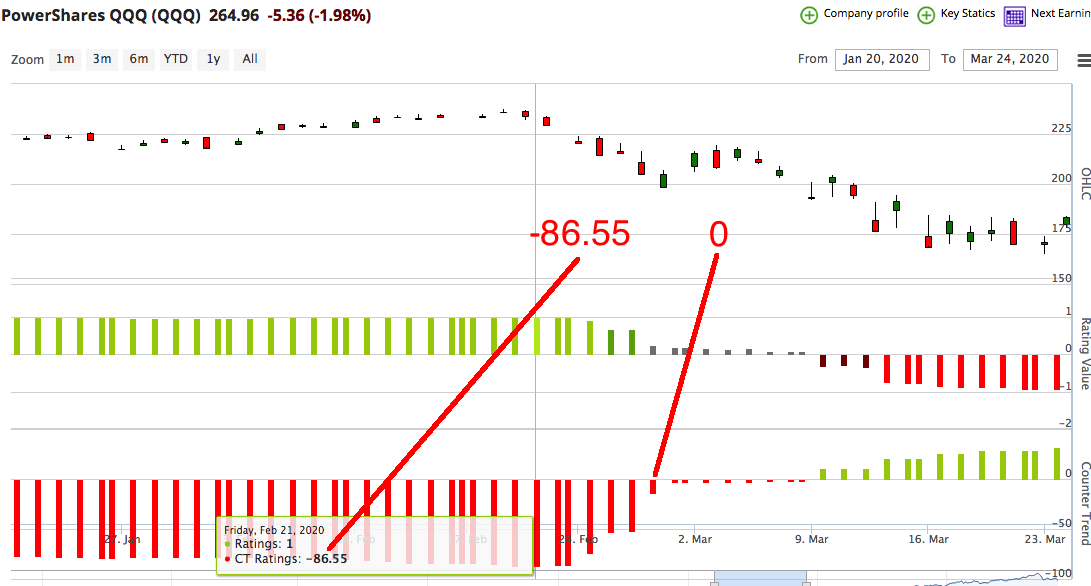
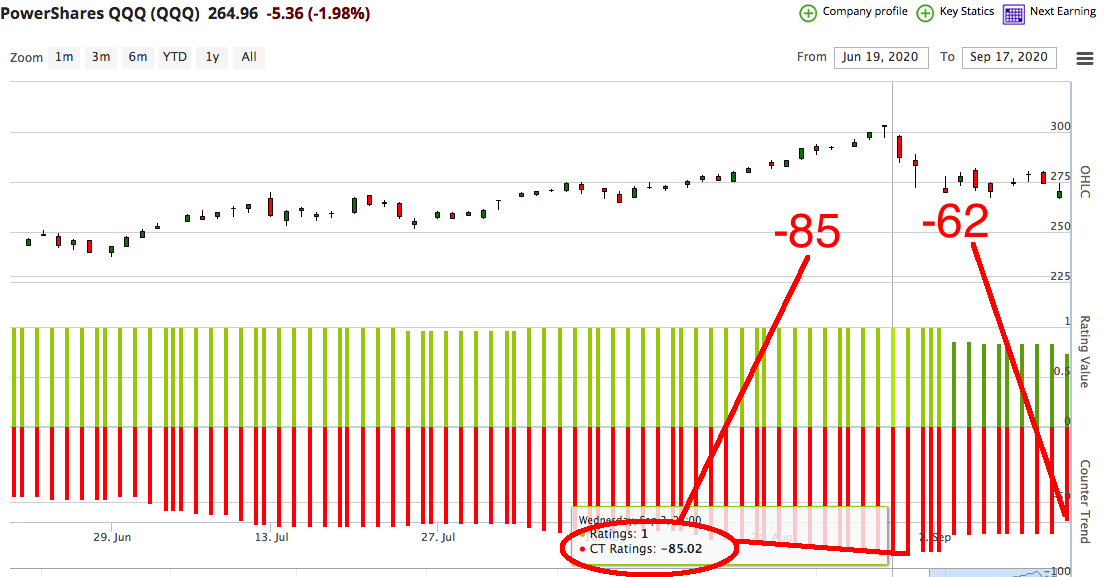
Sept 18th: PreMarket
Very little to report on this morning. Today is Quad Witching. As for the close yesterday on the NASDAQ it was a constructive close as the 4th attempt to break 10900 was rejected. Based just on the close I would expect an attempt to a rally today. The next short term resistance level for the NASDAQ Futures is 11,240 and 11,030 for the cash index. Today looks like a rotation from value to momentum, however, its too early to tell if this will continue throughout the day.
Sept 17th: Mid Day Update
I am updating the commentary more than usual, as I believe the set up is leading up to a constructive move in the indexes.
- This morning as I suggested, I thought we would get a bounce on the NASDAQ futures off of 10,940, “the low was actually 10,904”. However, I have held my conviction for the last few weeks and have said sell into rallies, ideally 11,600 (Futures) & 11,400 (Cash). My thesis for lower prices can be found in the prior commentary.
- We have said for long term investors, we would ultimately break lower on a close of 10,900 and to be patient.
- Today, we failed to bounce this morning, which provides further confirmation weak hands will push the index possibly today to 10,760. That might be a good entry level only for a bounce intra day. However, longer term investors I suggest waiting.
- As I have been saying for a few weeks a close below 10,900 will cause continued derisking of Vol targeting and trend following funds. Which will likely take the NASDAQ futures to its mean (green line below) of 10,600.
- An oversold condition would actually be 2 STD below the mean (yellow line below) giving you 10,000.
- Below I am using a very simplistic trend following Volatility stop with a Renko Chart for my levels. I personally like RENKO with a Vol stop as its doubly smooth as both are using average true range (OHLC pricing) and not just one price point. As I mentioned that many trend following qunts use Vol stops on the index level to reduce portfolio risk.
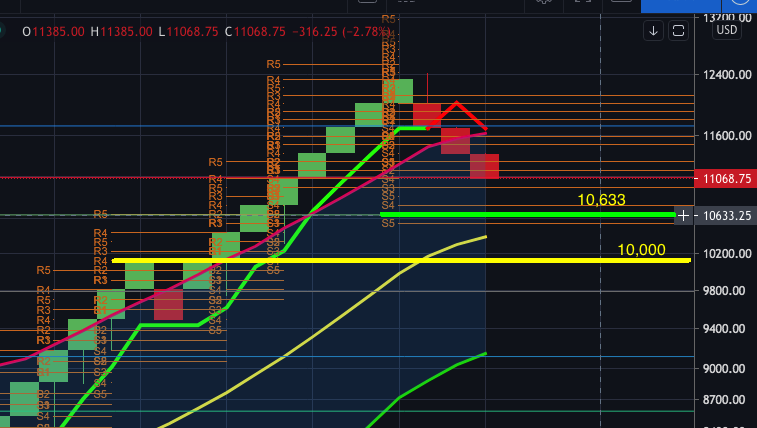
Lastly, I want to review our proprietary S&P 500 model and what we discussed on Sept 5th.
As seen below on the S&P 500 model 10 out of 12 times since 1992 once the model reaches a reading of 95 excluding 1995 & 2018 the model reverted 70% of the time on average to 0 reading. This is a robust enough data sample where I am waiting for more of a decline to get constructive. on the market. Can there be an outlier to this data of course, but I will stick with the math on this one. Bottomline we are sitting only at a 40 reading and believe more excess will be worked off on the index.
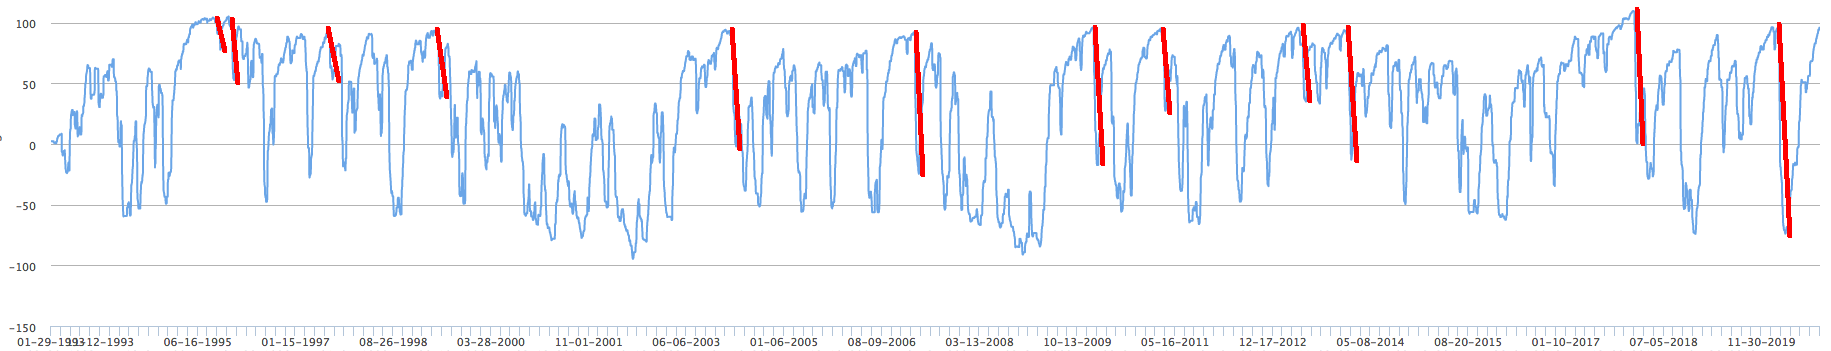
Finally the Strong Buy to Strong Sell ratio for the S&P 500
Since late August this data point concerned me. The S&P 500 tapped out at 3,584, however, the number of S&P 500 strong buys was unable to breach 350 stocks. This was very telling along with the number of strong sells increasing off new all time highs. As you know we do not want to see the green line fall below the red or greater strong sells vs strong buys. 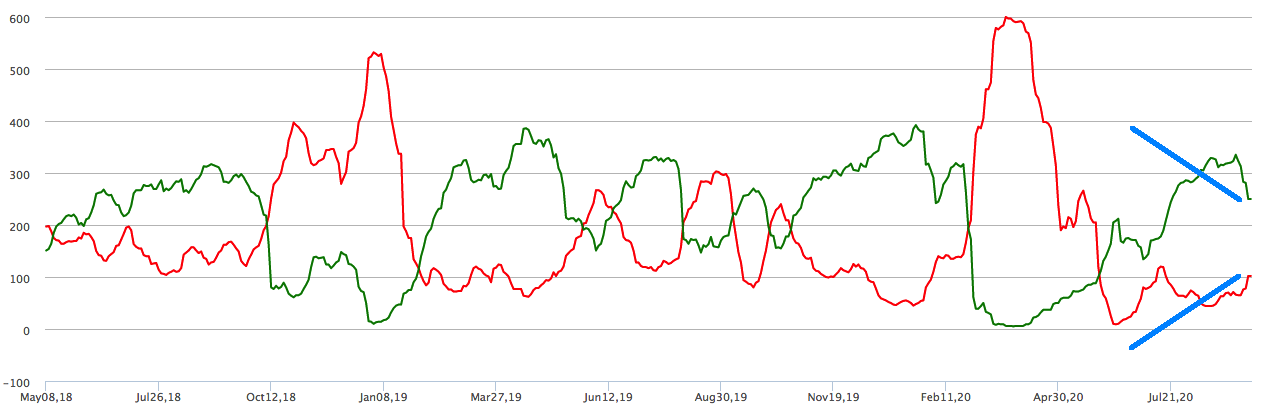
Sept 17th Morning note: Pre-Market
Note: we are having a server issue and some indicators and emails are not working properly, we are working on the issue.
Since the markets are breaking down this morning we want to reiterate what we have been saying since Sept 3rd.
- This morning the NASDAQ futures are down 250 points at 11,015. If we hit 10,940 this will be the third test. We might get a nice intra day bounce off this level for day traders (which I am not), I am not sure. However, as we said a close below here we will see 10,600. For long term buyers I still don’t think this level is a great buying opportunity and think we will get a better entry. As I stated back on September 5th, 10,000 on the NASDAQ would not be unreasonable based still on the technical overbought conditions and still massive overvaluations on technology.
- As for the S&P 500 3,300 has been significant support. A break below 3,300 will likely cause further weakness to 3,225. I think that based on the current environment that will hold, even though I think the S&P 500 is fundamentally overvalued still at 3,225. But as we know valuations are not a good market timing tool. Below are the levels for the S&P 500
- If Goldman Sach’s is right and the S&P 500 can earn $170 next year in earnings, that is 17.64 times forward earnings at 3,000. So 3,000 doesn’t seem that unlogical. However, the big unknown is what should the multiple be as rates will remain at 0 for the next 3 to 5 years?

Sept 16th
No change in opinion from Sept 10th.
Note: we are having a server issue and some indicators and emails are not working properly, we are working on the issue.
Premarket NASDAQ futures reached 11,550, pretty close to our target of 11,600 to reduce technology exposure. We have said for the past 2 weeks we are sellers of the NASDAQ and big cap tech as we feel prices are not constructive at these level. The S&P 500 held in relative well as financials and energy did catch a bid higher. As we mentioned on Sept 5th, I was less concerned with the S&P 500 as the NASDAQ, but neither index warrants more capital.
Tech and the NASDAQ were weak prior to the FED’s announcement today, but in typical fashion Fed days are often accompanied by selling. I wouldn’t be surprised tomorrow to see some reversal of today losses. The Fed had a slightly mixed message, while taking down their GDP forecast they did increase their inflation and lower unemployment numbers. This seems a little odd as you would expect GDP to increase with better unemployment and even great inflationary pressure and not stag or deflation. Either way, I think today was just noise from a Fed day.
Again, nothing to do as the set up doesn’t warrant the risk.
Sept 15th
No change in opinion from Sept 10th.
Dip buyers are now emboldened to try and ride the market back to old highs. I still expect to see 11,400 (cash) & 11,600 (Futures) Nasdaq possibly after today’s ramp into the close. However, I am still a seller, “not shorting”, just reduce technology at this level. A close above 11,430 (cash) & 11,650 (Futures) Nasdaq respectfully will bring in move buyers; which could drive the NASDAQ to 11,800 (cash) & 12,150 (Futures) Nasdaq respectfully.
At this juncture, I would sell into both levels above. I think the market keeps pushing the envelope of insanity. Today David Kostin, the Chief Equity strategist at Goldman Sachs who was clearly amazingly wrong on his 2,100 call until changing it to 3,600 after the S&P 500 rose 40%, was on CNBC saying the markets are looking to 2,022, well beyond 2021 earnings. What a complete farce and joke of a major bank equity strategies to even entertain such justification for insane equity valuations. Do these banks ever truly say what they really think behind closed doors.
Sept 14th
No change in opinion from Sept 10th.
After continued pressure the market finally got a small bounce, however, my opinion on large cap tech has not changed. I am not bullish or bearish, I just believe investors can find a better level to deploy capital. 10,900 on the NASDAQ did hold last Friday and with several M&A deals including a massive $40 billion semi deal from Nvidia helped the index’s bounce. The only large cap tech that held up todays early gains was Apple, which is still on a valuation basis very expensive at 33/34 times next years earnings with a similar historical growth rate. Let me remind you Apple prior to the Feds stimulus never traded above 15 times forward earnings growing at 10 to 11 times earnings.
As I mentioned last week, I am less concerned with the S&P 500 as the NASDAQ, as it’s more diversified and the laggers are starting to stand on solid footing. This certainly doesn’t mean I am going to deploy capital to chase the indexes back to their previous all time highs. Goldman Sachs reiterated Friday their 3,600 price target for year end, remember this is the bank that increased their 2,100 S&P 500 price target as the S&P 500 already traded to 3,200. They are estimating the S&P 500 will earn $170 next year. Which is amazing because the S&P 500 was earning that in January 2,020 with an economy at full steam 2% GDP trading at 3,300. At 3,600 with $170 in earnings that seems rather rich for an economy that still has 15 million unemployed and no growth. However, we are still sitting with a Fed balance sheet of $7 trillion and $4 trillion of government stimulus; however, that most likely has been utilized.
I am still a seller at 11,400 (cash) & 11,600 (Futures) Nasdaq until the current setup changes. Wednesday we have the Fed, it is not expected that they will present any changes to their inflation projections or liquidity measures. However, I would expect some market volatility as usual.
Sept 10th
Today should not come as a surprise as we have said the markets are still overbought and our models still have not worked off the excesses that we discussed on Sept 5th. As we said yesterday sell into 11,600 on the NASDAQ futures. On any rallies I would be a seller.
Why I am a seller:
- As I mentioned on Sept 5th, I am looking for the blended S&P 500 model to revert to close to 0 and the NASDAQ counter trend to work off considerable more overbought conditions. Both are still overbought. Please refer to the site for current readings.
- Both the S&P 500 and NASDAQ as mentioned crossed below their volatility stops ( green line below), thus causing CTA’s & trend followers to reduce portfolio long exposure. Typically rally’s will be sold until both index’s cross this vantage point.
Downside Risk:
I think its feasible that the 10,900 level on the NASDAQ futures do not hold and we can see a flush to 10,500/10,600. Short term traders will play this bounce. However, If we close below 10,600, the next level will be the “mean” seen by the yellow line below of 10,393. I think based on fundamental valuations, 10,393 would not be a significant correction, but a pullback. For the NASDAQ to become extremely oversold we would need to see 2 standard deviations below the mean (bottom green line) or 9,300. However, based on the dynamics of the Fed’s balance sheet expansion, I currently don’t see a breach below the mean of 10,393. But we will be watching this real time to evaluate how to play this.
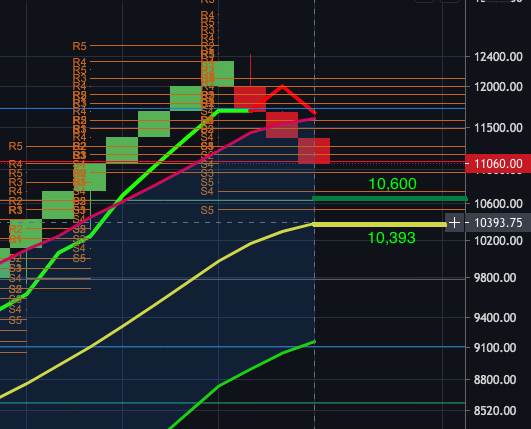
In summary there is nothing to do yet.
Sept 9th
After the fastest 10% correction from the NASDAQ all time high, dip buyers felt there was opportunity. Below we discussed 10,605 as the next level on the NASDAQ, however the index only hit a low of 10,837. However, Step 5th, we said we were looking for a test on the NASDAQ futures of 10,930, which after ours we did hit 10,935.
Regardless of this bounce I would be selling tech related NASDAQ names into a further rally into 11,613. At this juncture, I am more concerned with high multiple technology stocks than the more diversified S&P 500. Regardless of the 10% NASDAQ correction, the underlining stocks are still massively overvalued.
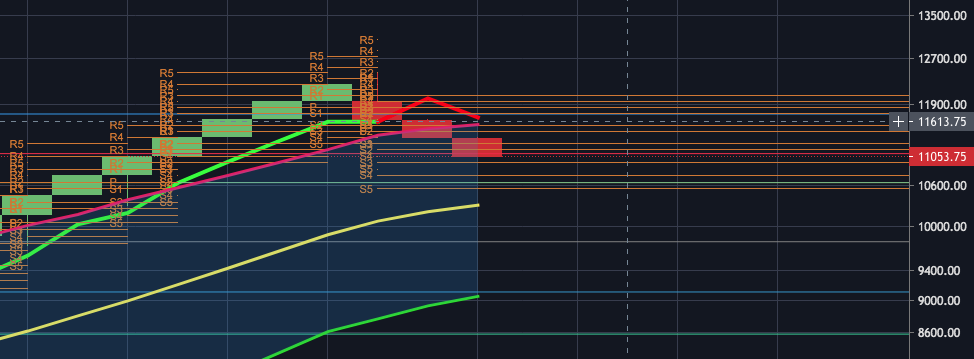
Sept 8th
Quick note:
We already provide on Sept 5th our reasoning for lower prices. Below is the next major support of 10,6050 level I am looking for on the NASDAQ. This must hold or a full correction is probable to 9,800. Until the close we wont know how much of the prior excess overbought condition has been worked off.
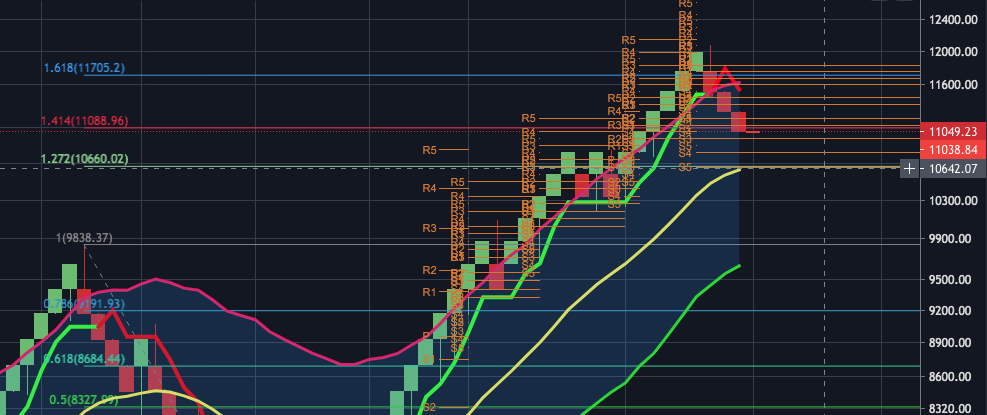
September 5th
Some quick thoughts about the current environment:
- Now that market participants can explain some of the recent melt up caused by the short gamma squeezed caused by an unprecedented amount of call buying by both Softbank and even retail investors the question remains does this trade a. unwind? b. and if so by how much? This answer is almost impossible to quantify how much of the recent melt up was attributed to the short gamma positioning. However, what I do believe is a likely outcome is for our S&P 500 and NASDAQ models to revert significantly more. We will discuss at the end of our commentary.
- Our S&P 500 model has not come off much at all and the excess have not been worked off after this 4% move lower on the S&P 500 and about 6.50% to 7.00% of for the NASDAQ.
- Because of the nature of the fastest appreciation ever in both the Nasdaq and S&P 500 83% and 60% respectively, off the March lows, the first pullback was a welcome opportunity for dip buyers.
- However, I still believe rallies will be sold and the S&P 500 model or QQQ counter trend will still work off this excessive overbought condition.
- Valuations are still massively stretched, however, what is the true fair-value with equity risk premiums increasing as the Fed is on hold for the next several years?
- This week we finally got some answers to as why Facebook, Netflix, Apple, Amazon and Google were gapping up 5% to 8% a day. It was out earlier this week reported by zerohedge that there was a massive call buyer in these names that was causing a gamma squeeze and causing this buying frenzy feedback loop. It turns out it was Softbank that was purchasing $4 billion of calls in about 6 to 8 of these stocks which they already owned the underlying stock. Depending on the the strike prices, this could potentially be $100’s of billion worth of buying power. Why would a more traditional VC/PE firm do this and are they done buying calls? Read here
- In conclusion, I am still sitting on the sidelines and waiting for the S&P 500 model to revert further, before deploying more capital. Read below for greater details.
S&P 500
As seen below in the S&P 500 model all 10 times the model reached 95 excluding the 2 times above 100 reverted to at least 50 and on average a 0 reading. This is a robust enough data sample where I am waiting for more of a decline to get constructive. on the market. Can there be an outlier to this data of course, but I will stick with the math on this one.
NASDAQ
As for the NASDAQ, I still think we need a larger flush out to bring in longer term buyers. Looking at the NASAQ futures below I am still looking at a test of 10,930 futures and a close below this will be 10,000.
If we close below 10,900, there is a high probability we see 10,000. Two reasons, 1. The NASDAQ counter trend is still a -82, that is alot of excess to work off. 2. this is the first time quant (trend followers) will be reducing exposure as the NASDAQ has broken its Volatility stop seen below in the red bricks breaking the green line. This is a common risk management price tool used by trend followers to adjust portfolio exposure.
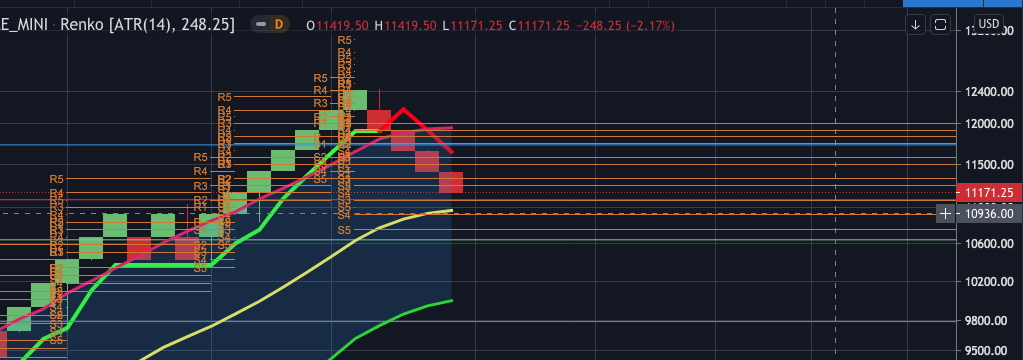
September 4th
Quick note: Today I am looking for a bounce on the NASDAQ at 10,800 level give or take
September 3rd
The close
The S&P 500 held the mean support level of 4,330 so a possible bounce tomorrow as the index was saved today into the close as well as the NASDAQ held its mean of 11,340. I still want to see a larger flush out before allocating capital. But anything is possible. The tell yesterday was the unwind of call buying in Apple and TSLA. The calling buying noted by Goldman and Zerohedge has called a gamma squeeze in recent weeks within large cap tech causing these large moves. Its hard to tell when or if the unwind will stop.
Tomorrow we have jobs number that will certain be a market mover. I can see the administration now coming to the table with the Democrats on the stimulus plan as the market got hit today or if we head lower as a positive catalyst.
Mid Day
I don’t like to typically post intra day, but I would refrain from trying to buy this dip today. I am not going to discuss NASDAQ and S&P 500 levels yet, but if we close on the lows of the day, I am looking for the blended model to retrace back to at least 30 before the selling is over. This is just an educated guess based on the historical retracements of the model see below. I am not yet that bearish to believe the model will revert to 0.
August 29th
For those of you have been waiting for the 93/95 reading to pull exposure now would be the time. However, could this be an outlier and move above 100 like 1995 and 2017? Absolutely, the Fed basically said they don’t care about inflation and moved the goal post and they are not projected to raise rates until 2025 and most likely never again. Could this turn out to be the biggest bubble in 2 decades, sure why not. So I certainly would not be in 100% cash at this juncture, but I would be reducing exposure to the most overbought technology stocks.
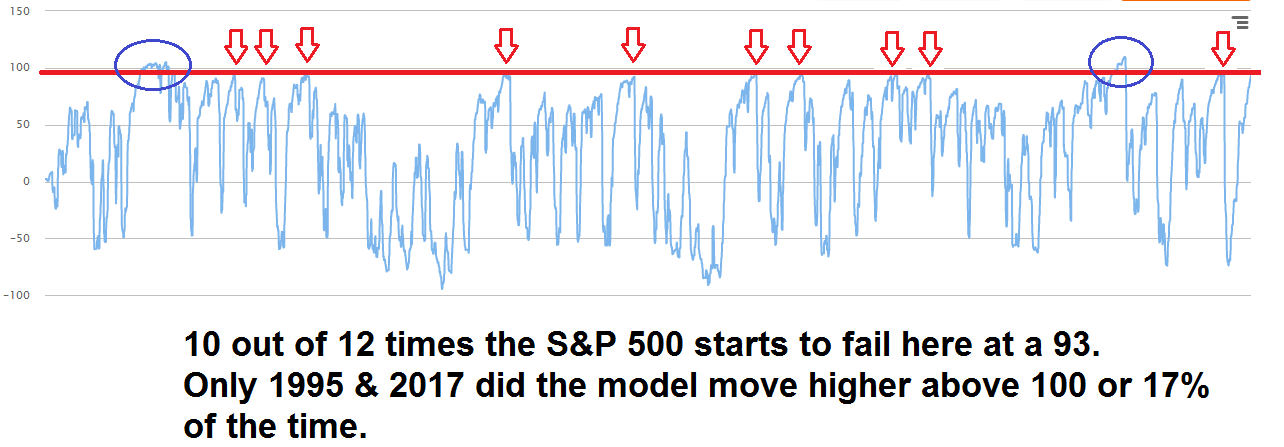
August 22nd
I am looking at 2 proprietary data points right now that is raising my caution level on the S&P 500 and believe reducing equity exposure is highly warranted. As we have mentioned this period in history is unprecedented and investors have little historical reference based upon the massive stimulus. However, here are the 2 things I am looking at that raise caution for me.
S&P 500 model is now sits at a 89. While 89 is not in the top percentile of overbought. The last time and only other time in history the model advanced consecutively from a massively oversold -74 to 89 was January 2019, which saw a 7% correction after this move back to a 0 reading. While a 89 is not massive overbought and is only the 13th most overbought S&P 500 reading since 1992. These two occurance’s from -74 to 89 is the greatest advancement since 1992. The issue here is the limited data set, so I would caution a -74 to 89 alone does not provide enough framework for an eminent selloff. However, this coupled with the lack of participation in the strong buy to strong ratio (third chart below) and even a decline in recent days is signaling concern.
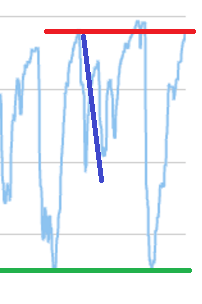
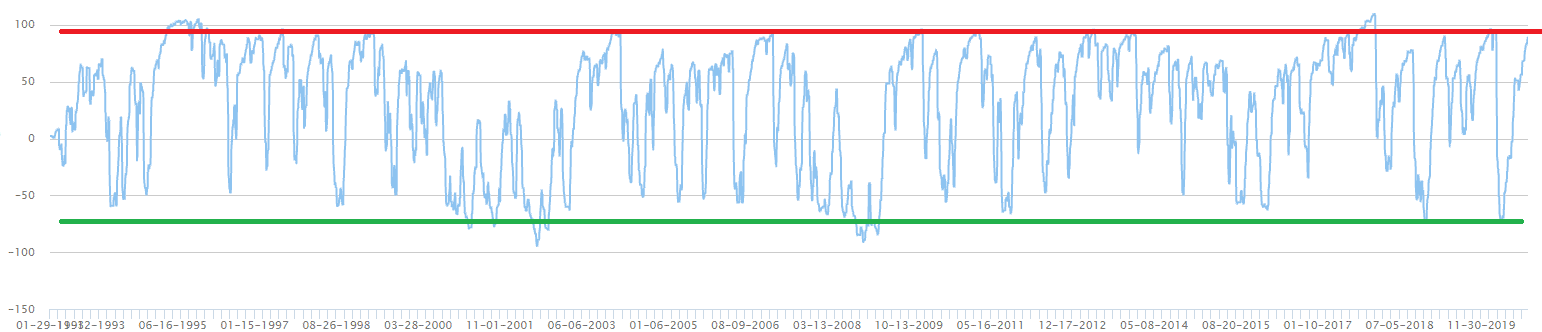
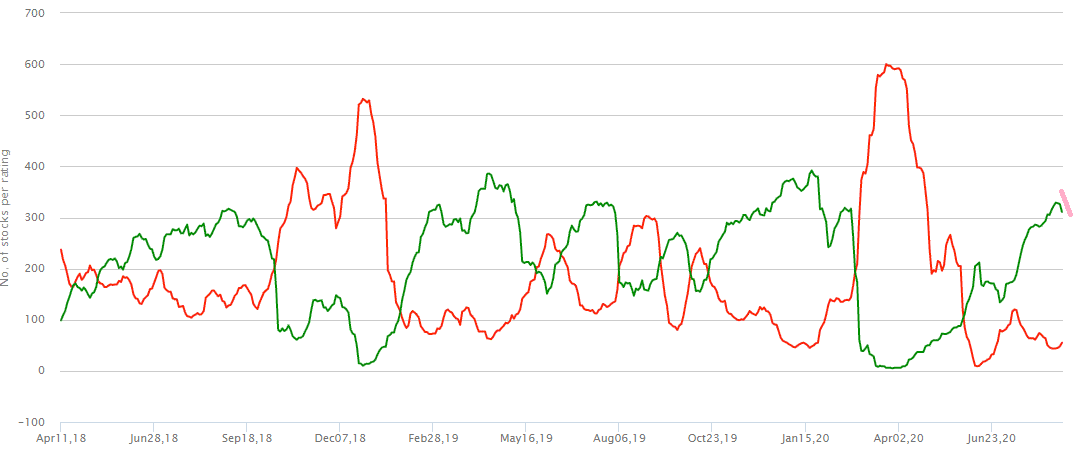
As for the NASDAQ the the counter is now a -77 (see red lines in first chart) which is extremely overbought, however, last years melted up in the QQQ saw the reading get to a -84, which is another 5% higher. However, the breadth was better in February 2020 when the reading achieved -84.
The second chart is the NASDAQ futures, I believe 11,600 will cause a potential pullback to the longer term mean of 10,902 for a 700 point correction. The question is will this be bought and I think it will as many investors have been waiting to get back into the market. But this is purely a speculative guess based on the fact for the last 4 months the index has bounced significantly off the mean (teal blue line). We would need a significant catalyst to break this mean price trend and valuations are never a great catalyst besides small 5% to 6% reversions.
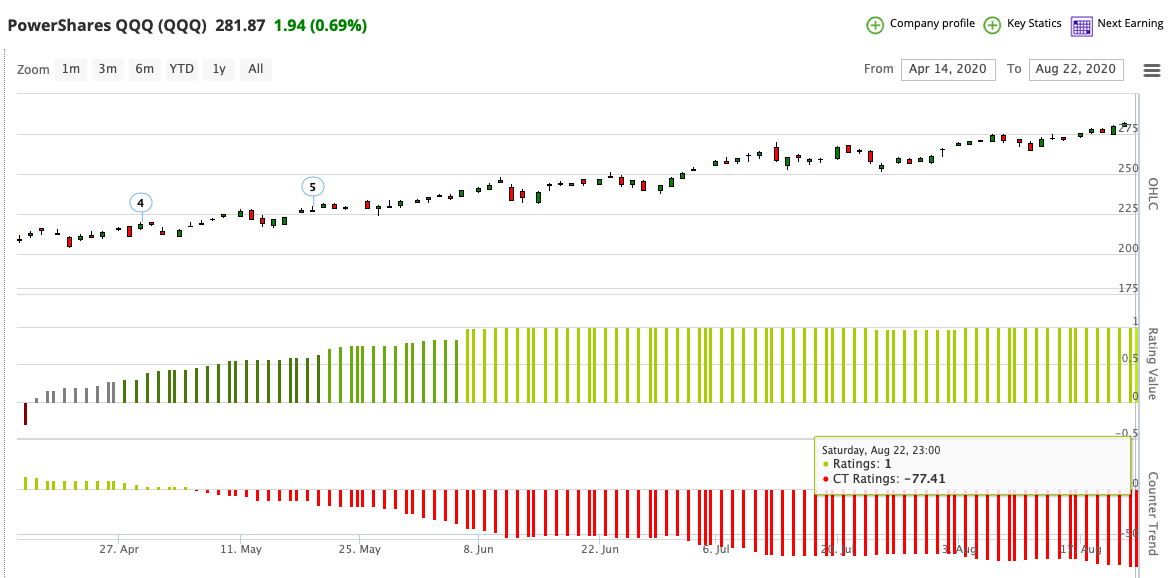
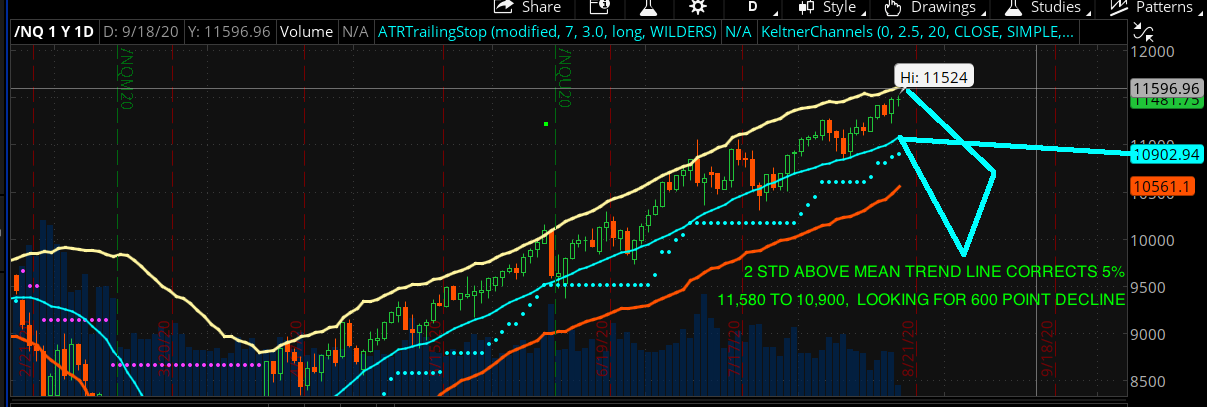
August 12th
Throw out fundamentals because they don’t matter, the question is how much higher do we go with $88 trillion of stimulus on a global market of $90 billion? Lets just see the correlation of global liquidity to the S&P 500 below. As we have been saying for months now, if liquidity doesn’t pullback, then you know the trend… up. 26 to 28 times earnings is astonishing, but PE is irrelevant as the markets have never been here before with this much liquidity
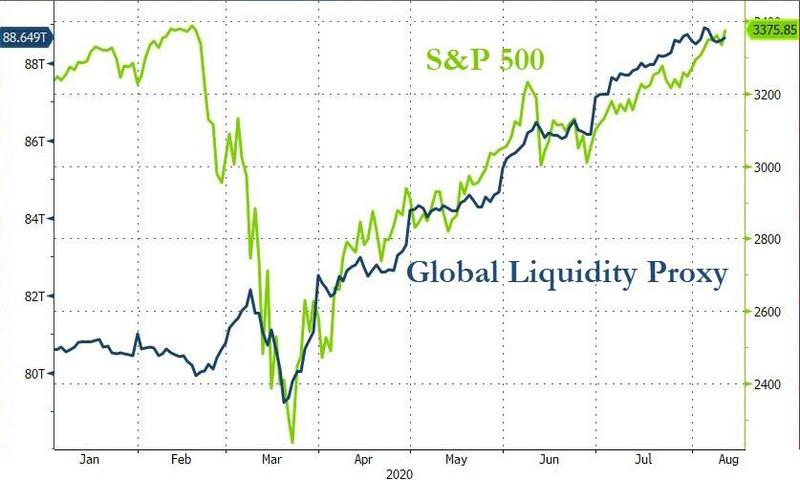
August 11th
- Today we finally got to the S&P 500 all time high or 5 points shy to hit a intra day high of 3,381. I did say on August 6th I would definitely be a seller at 3,380. If you sold any into this level, lets see if we can get even higher levels to sell into.
- I still think with the current sector rotation we will see new highs, unless technology closes below 10,700 for a deeper correction. I personally think the sector rotation is a stupid thesis as banks are not growing nor are they under valued with the current state of unemployment. But systems and machines are in charge and when you get such a large divergence between value and momentum they will sell momentum and go long value.
August 6th
- On July 15th I stated, “A close again above 3,245 will take us to 3,270 and then the all time highs of 3,384. Well today, we filled the S&P 500 (futures) gap of 3,300. With additional stimulus coming online within the next week, I expect to see the 3,384 level (all time highs), which we are essentially there already. See S&P 500 model below for further details.
- S&P 500 Model Target
- I do think we fail at the all time highs at 3,384, here is why:
- The S&P 500 model is currently a 78 reading, which 50% of the time fails here or advances to a 92.
- If the model does advance to a 92 that is another 2% or just above 3,400. A 92 reading 88% of the time corrects on average 6% to 7%. There has only be 2 times since 1992 that the model made it to a 100 or 12% of the time.
Click to enlarge
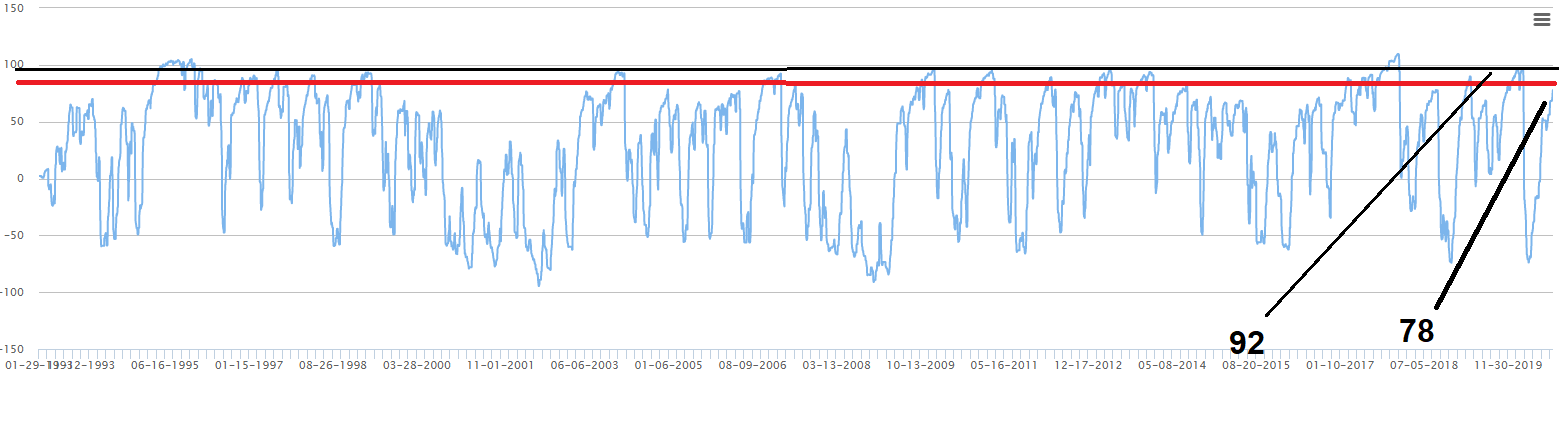 NASDAQ
- As for the NASDAQ (Cash) not futures, we said on July 30th to expect to see 11,000, today the index now sits at 11,090.
- NASDAQ Target:
- The NASDAQ has a counter trend (measurement of overbought) of -70, as you will recall before the index corrected in February 2020, the index saw a reading of -85.
- To put this in perspective, A -85 reading has only occurred 5 times in the last 28 years.
- Another -15 additional points on the index would be another 7% to the upside NASDAQ (cash) 11,800 or 12,037 (futures). While I don’t think we will see such a overbought condition this time around, however, with $14 trillion in stimulus it is not out of the realm.
- The NASDAQ will experience some tough resistance at the next major resistance level at (futures) 11,380 and NASDAQ Cash of 11,150.
While I think any rational investor knows the multiples are rather stretched, even with rates heading to zero. The 10 year yield is now at its lowest level ever at .54bps. I don’t think any sizable correction is close, however, as Goldman noted today, a vaccine will cause a major outlier and repositioning and a crash in technology. When congress pass’s the newest stimulus round that will bring the total stimulus to $12 to $14 trillion on a S&P 500 with a market cap of $24 trillion. The Fed can’t nor are they going to reduce their liquidity measure until well after GDP is back to 2%. Therefore, the market needs to move even higher before popping any bubble in my opinion.
If the Fridays job number is decent and if we finally hit 3,380 I would definitely be selling stocks and raising cash.
July 30th
On July 24th we said we were looking for the NASDAQ would see support at 10,177. However, the index only hit a low of 10,217. After Hours the index is now trading roughly 10,787 after very healthy earnings from Apple, Facebook and Amazon. I still believe the entire market is expensive, but at this juncture the index should take out its all time high of 10,839. Markets love round numbers and expect to see 11,000 for the nasdaq.
More importantly, Fed Chairman said yesterday that he will not be removing emergency liquidity until long after the economy and employment returns to pre crisis levels. I know expect with this out look to now see a full blown bubble before the market see’s a 10% correction. That means a 90 plus reading on the blended S&P 500 model. While, I hate investing based on the Feds massive liquidity inflating assets, the reality is the market is telling investors we are going higher unless there is a new unforeseen negative catalyst to hit the markets.
July 24th
On July 14th I said, “right now technology is the focus as the NASDAQ will be under pressure, I am looking at the 10,177 level for support. I am still looking for this level in the short term for a possible bounce. A close below this level will bring in significant selling pressure potentially to 9,600. As for the S&P 500, we are seeing strength rotate into Financials, Industrials and other economically sensitive sectors that have lagged.
Our S&P 500 model has reached a critical inflection point of 68. An increase to a 68 from below -50 rally has a greater than 50% probability of falling and seeing a 5% to 6% correction. However a significant break above will cause a significant move to 90 or a 5% to 7% move higher. So when I say inflection, its rather binary at this reading. However, if Financials, Industrials, Staples and Consumer Discretionary can see continued strength, the index could just consolidate at these levels.
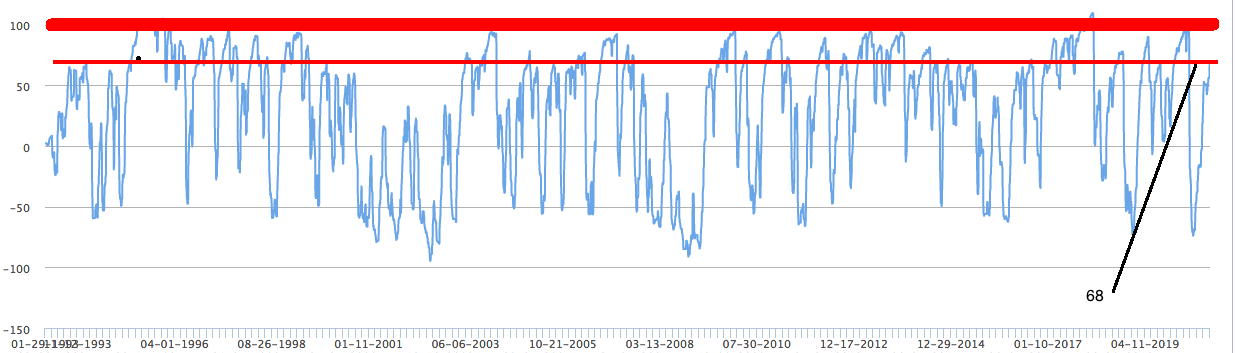
July 20th
As we said repetitively, the biggest benefactor of the Fed’s liquidity are momentum stocks / high multiple growth names. Since September 2019 when the Fed started increasing its balance sheet from $3 trillion to $5 trillion, momentum and high growth significantly outperformed. Last week after 4 weeks of the Feds balance sheet declining coupled with weakness in the NASDAQ we finally saw the Feds balance sheet increased once again (SEE BELOW). This… along with “ONLY” a price target increase from Goldman and Jeffries on AMZN sent the NASDAQ up 2.60%. Every S&P 500 sector was down except consumer discretionary that holds a 24% position in AMZN.
S&P 500 futures closed above our target 3,245, next stop 3270. Maybe we will see some give back tomorrow within the NASDAQ which would be typical.
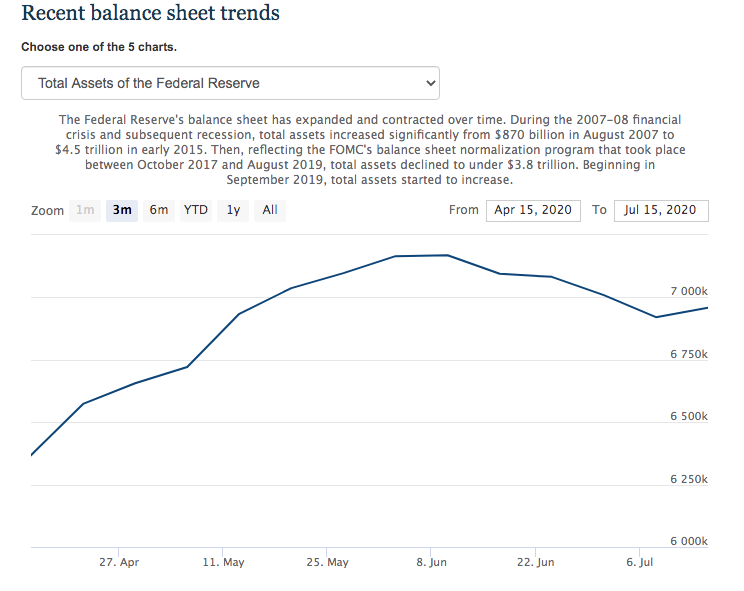
July 15th
Ok, now this is getting to be just incredible. The S&P 500 futures in the last 24 hours has rallied 100 points off the lows. Yesterday at the open the futures hit 3,118 and with a high today of 3,233 just about 3%. Even before 2 solid vaccine news headlines the market rallied yesterday about 70 handles from the lows.
My opinion is if these two drugs really will have a vaccine in Q3 / Q4, technology / momentum will stall to even decline. Higher growth / higher multiple stocks significantly out perform with a larger balance sheet / more Fed liquidity. In my opinion if there is a vaccine the market will smell a reduction in the Feds balance sheet to a more normalized level. While I haven’t a clue on the validity of the trials or effectiveness, I am only stating that value will outperform growth when there is a true vaccine and a normalized Fed balance sheet.
Now today the S&P 500 futures failed for a total of 4 attempts at a critical level of 3,226. Now I am using 3,245 as a breakout as I am using a multiple above 3,230 for confirmation of a breakout. Do I think we breakout? Well at this point why would we not, the market has been thrown almost every possible and conceivable negative news. While, I think retesting the all time highs at this juncture is a farce of a market , it doesn’t matter, the market is speaking that it doesn’t care. I still remain cautious until we do breakout and even beyond. A close again above 3,245 will take us to 3,270 and then the all time highs of 3,384.
July 14th
Yesterday we saw a key reversal in the NASDAQ and momentum stocks potential start a momentum crash. The S&P 500 futures hit 3226 rather close to the 3,240 we have been discussing before a pullback of 70 points. The catalyst for the sell of was as the Feds Kaplan said as the economy starts to gain strength liquidity facilities will be reduced, meaning the balance sheet will be reduce. Then about 30 minutes later California rolled back reopening of their restaurants and bars and other businesses.
Right now technology is the focus as the NASDAQ will be under pressure, I am looking at the 10,177 level for support. The S&P futures are trading at 3,140 this morning and really not worth the risk reward to get long here. If the NASDAQ does test 10,177 then maybe there will be a better set up to get long again a few tech names that have strong cash flow and balance sheets such as MSFT. Until then we are still in no man’s land.
July 10th
In my opinion, this move today was incredible. For the 4th time in 4 weeks the Feds balance sheet has declined. I would have expected greater price deterioration this week after a large decline in the Feds balance sheet. I believed this would have caused some greater volatility and downward price action. The trend following factor is just too strong right now until its not.
The only thing that maybe the reason the S&P 500 is not declining in the face of a shrinking balance sheet is that the Fed is not pulling the liquidity. As we mentioned before, its a result of less institutions needing to access liquidity as stress of the financial markets normalize. The decline is a result of swaps being taken off and less institutions needing to access more dollars. I think think that given any risks to the market we will see increased volatility as the balance sheets is declining.
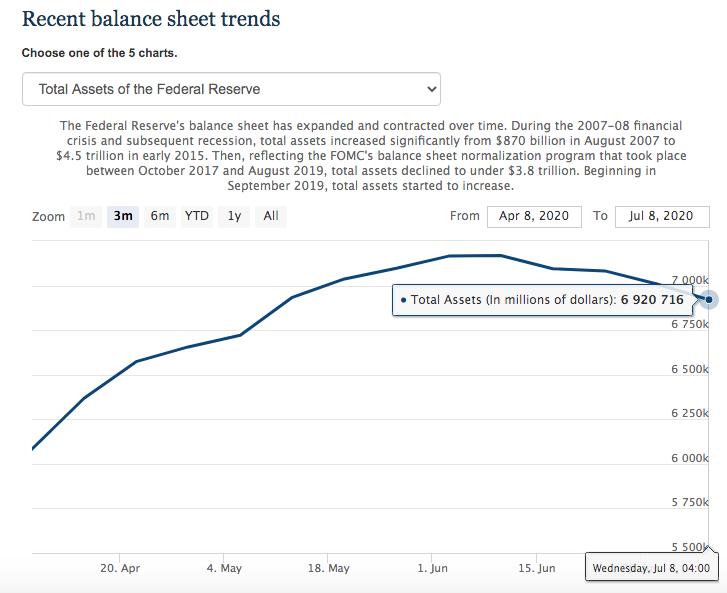
Fridays news of Gileads positive drug got the “news driven quants” full bid. The S&P 500 saw value stocks significantly rally which helped fill the gap today. For weeks we have discussed the 3,169 level in the futures, and today we closed above this level, which most likely will cause a retest of the 3,240 level that we discussed. I find it very hard to justify a true breakout above 3,240 at this juncture, but with this market or circus of a market anything is possible. Again, as we mentioned several weeks ago, we close above 3,240 on a weekly basis, its a very good chance we see the historic highs, at which point, sell.
Anyone who has a clue about fundamentals realizes that the market is purely trading on technical trend following and all multiple expansion not a V shape recovery. Granted ChartLab and Trowbridge fall into this camp o trend following and this is why I am even more convinced that fundamentals are irrelevant and not even being discounted at this juncture.
This week was a great example of the insanity and how lame Wall Street analysts really are display by Deutsche Banks upgrade of Apple was seen below was. It may be the laziest example of lack of true analysis and true research. By the way I thought John Fort was rather good calling out the analyst for upgrading the stock strictly based on giving Apple a peer multiple as the reason for the upgrade. The lazy analyst compared MSFT as a peer to AAPL. This is interesting as one is a hardware company with 3 businesses and the other is a diversified cloud based services/software within 20 businesses and margins are about 1000 bps higher. One MSFT for the last decade has traded 10 multiples higher than AAPl based on this fact. This lack of true analysis is why the sell side is a complete farce and strictly a case of trying to generate commission for the sales side and raising prices not to be seen like a fool as stock prices rise.
July 7th
As I mentioned, the most important thing I am watching right now is the Feds balance sheet. As of July 1st the balance sheet has now declined 3 weeks in a row. This decline was not as a result of a Fed action, but it was supposedly from swaps expiring or being unwound. Regardless of the reason I think this will cause some price weakness.
I do not have a strong opinion right here at 3,150. As of yesterday, I was thinking the S&P would have at least tested 3,205 and then 3,240. Regardless, I would not be looking to add to new positions unless you are already in a high level of cash. As you know from my previous posts, this market fundamentally is so expensive and has lost all sanity in many individual stocks.
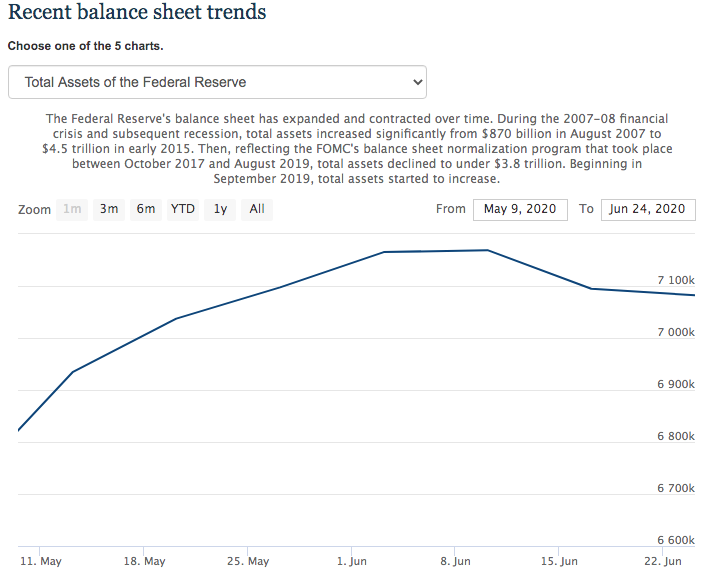
June 30th
Back on June 27th we believed that the next major test for the S&P 500 was 2,945. Sunday night the S&P 500 futures hit a low of 2,983 and never looked back for a close today of 3,083. Today the market saw a massive 6.5 billion buy at the close imbalance catching investors who expected pension rebalance selling off sides. The market spoke Monday after recovering from Sundays 2,983 and brushing off the bad news and refused to break lower.
Additionally, we mentioned that we could just trade in this wide 200 point range until a clear breakout or breakdown. Fundamentals are almost irrelevant at this juncture as the S&P 500 is being propelled higher from multiple expansion strictly from Fed liquidity. As long as the Fed keeps the balance sheet from shrinking the market will be strictly driven by the liquidity.
You can have all the Wall Street strategists telling investors that this is a new bull market or that the new Covid cases we are seeing have a much less fatality rate. Lets not kid ourselves, the truth is they are all clueless and trying to generate revenue for their firm and non of these firms have any ability to forecast long term returns. The only thing any investor needs to know is if the Feds balance sheet is expanding or shrinking because there is no such thing as a true market anymore.
June 27th
The Fed’s balance sheet is the only data point that investors should be focused on. Here is the Fed’s link to the balance sheet.
As you can see below for the past 2 weeks the Fed’s balance sheet has been declining as has been price deterioration and increased volatility expansion in the S&P 500. I am in the camp regardless of the increased Covid19 cases over the past 5 days, the balance sheet is the only true factor “IF” the S&P reverts lower or tests February 2020 highs.

Friday’s close.
Our S&P 500 blended model has not changed in 14 days as the S&P 500 has been trading in a wide zone and until this zone is broken, I expect to trade in a 200 S&P 500 range. I believe the catalyst to break out of the zone will be highly dependent upon the Fed’s balance sheet.
The S&P 500 futures were rejected for a 4th time this previous week at 3,145 and didn’t even test the 3,169 I mentioned on June 22 as a critical level for a 3,240 retest. So why did the S&P 500 correct 130 points this week, second wave fears? Prior to this weeks significant jump in new cases in FL, TX, CA and AZ the S&P 500 starting experience price weakness and market internals weakened since June 16th. (see second chart below) For the last two weeks the underlying bid underneath the market has been weakening as the FEDs balance sheet has been slightly declining since June 15th, almost exactly when volatility ticked up and the S&P started to breakdown. However, investor “anchoring” allowed for a few days of buy the dip into the declining balance sheet.
The Fed’s balance sheet is the only thing that matters for equity prices, don’t fall into the narrative that their is a V shape recovery. The recovery is strictly asset price recovery from Fed liquidity to control credit spreads and thus control contagion within corporate debt and the banking system. This week, I am looking for a test of 2,945 and this must hold 2,917 on a close or we can be looking at 2,830. (see third Chart).
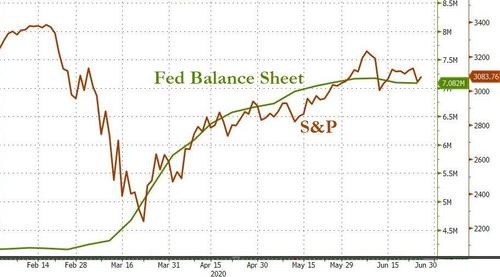
It has been almost 2 weeks now that the Fed’s balance sheet has been declining and during this period, the number of strong buys within the S&P 500 have declined from 212 to 150. I am highly concerned that the number of strong buys never expanded beyond 250 names or 50% of the S&P 500 and now reversing course. 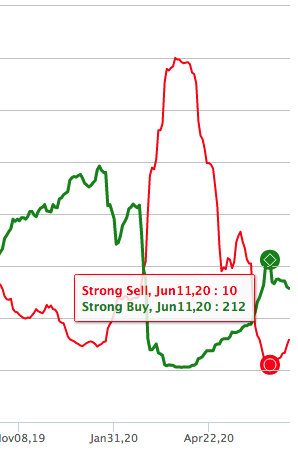
As seen below, “click to enlarge” the middle green line is the ATR stop at 2,919. We broke above it on March 25th for a massive buy. This needs to hold on a close, or we are going to see a lot of medium term traders hit the sell button. If we can hold and bounce here, I would expect a significant rally back to 3,100.
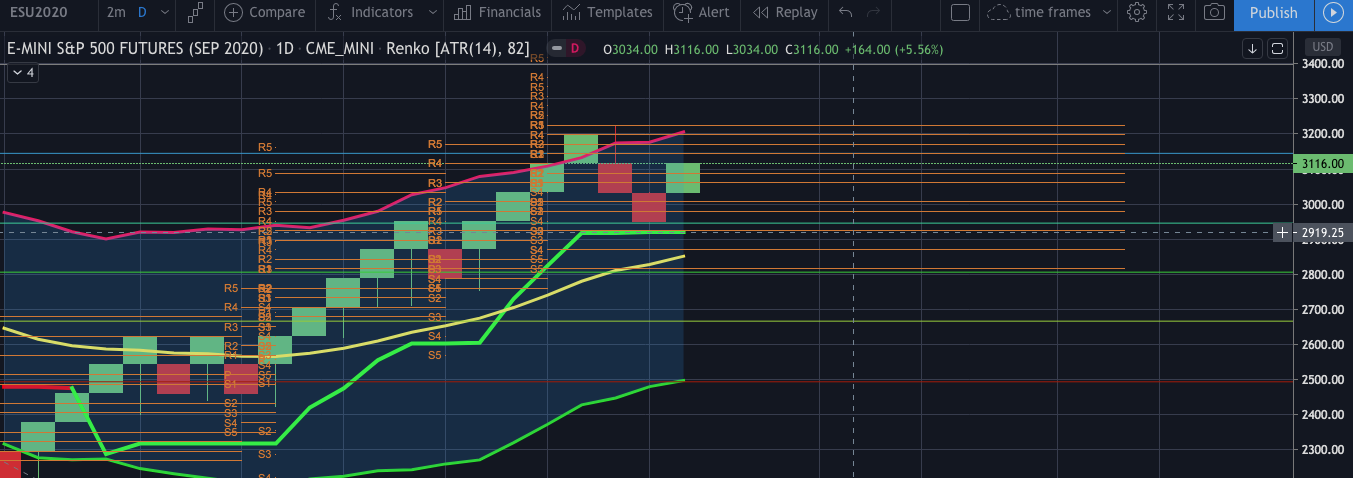
June 22
Sunday night the futures hit a low of 3,027 as of 8:00 Monday night the futures hit 3,122, almost a 100 point rally from the lows. Astonishing, I don’t care how long you have been involved in the market, no one has seen this type of price action with such a dislocation from fundamentals. The market had 3 major chances to fail and reverse low in the past 7 days and refused to break. At this juncture, of the S&P 500 can close above 3,169, we will retest 3,250. Its almost inconceivable to say if we close above 3,250 that we will retest the all time highs, but there is a good chance that will occur.
June 21st
Very little to report on the current level of the S&P 500. Fridays option expiration pinned the index to 3,100. However, the futures were slammed 40 points after hours for the S&P 500 hitting 3,055. According to Goldman Sachs, this Tuesday we will have another massive pension rebalance of $75 billion of equities for sale. I expect between the pension rebalance and fears of a second wave the S&P to come under pressure until Wednesday. I would expect to see 2,988 on the index without a problem. The last thing I would be trying to do is buy any of the reopening trade stocks at this juncture, like the airlines, cruise lines and energy. The index in my open as I stated can easy retest 3,240 or rollover to 2,850. While this is not what anyone wants to hear and rather binary, there is no edge at this current level to take risk. I personally, am leaning in the camp that the market is massively overvalued on a fundamental basis and after a massive rally from the lows, its not time to be aggressive with your equity allocation.
June 15th
The insanity continues. Sunday night around 2am the S&P futures hit a low of 2,923, as of 7:50 PM Monday night the futures hit a high of 3,089. A 160 point reversal from the lows or 5.4% off the lows. The Fed today announced a specific date on old news that was already in the market for a few weeks that they will buy corporate individual debt of companies and the market rallied 40 handles mid day at the S&P was flat.
While I understand that they must do this in order to hold together the system to avoid certain systematic risk to avoid a 2008 style implosion of the credit markets and financial system. However, financial market are so distorted from reality, its hard to remain long equities with a straight face. At this juncture we close well above 3,036 and mostly take out 3,100 tomorrow and try to test the next important level of 3,167 to carry the index back to 3,240.
Here is a good article if you have not already read it to give you a good understanding why the Fed is so intent to backstopping the credit/bond market. Read the Atlantic here
June 12th
Yesterday we had a massive move lower on the S&P 500 down 180 points. The catalyst call it what you will but the important thing right now is today we successfully tested the lows of 2996 three times and bounced off them to close at 3025. This will bring in a few buyers next week. However, we are not out of the woods as we closed below 3,036 which is currently an important level. I still believe the market to be overvalued in many stocks. I think we sit at an important inflection point and we can either test 2,830 or 3,250 at this current level.
June 10th
As we mentioned in our last post it seemed 3,250 was likely. Today the S&P 500 futures hit a high of 3,231. Does the insanity stop at 3,250? I don’t believe at this juncture 3,250 will be a longer term resistance level. Too many quants are coming back into the market buying. The 1 thing that could spark a correct is a sharp spike higher in rates as the 10 year is starting to move higher.
June 6th
- What yesterdays jobs number a game changer? The largest miss ever on record, jobless claims were estimated at over 7 million losses and came in with 2.5 million gain. We can surmise that the PPP employee insurance had a major impact on this. However, I am still skeptical about this number. Regardless of my skepticism of the number and this market being completely a fake market based on valuation and how it has been backstopped, non of this matters.
- There was a 50% chance as I mentioned on June4th we would fail in the +35 to +40 blended model reading. The model now sits at +48. Based on historical readings, it is a low probability now that the model fails at this level, it is possible, but I doubt it. It now looks like +60 is the next stop and in terms of the S&P 500 if the S&P 500 closes above 3,250 especially on a weekly close, we could test the old time highs.
- I have a great deal of trouble thinking that this market will retest the old highs in 2,020 and believe the risk out way the reward for any conservative investor. However, this market is no longer being driven by human traders and algos that remove all emotion and rational from buying and selling. I see it first hand with our own models. The last 4 months has been unprecedented and not a single investor alive has seen such market behavior.
June 4th
- We are now at a major inflection point with the blended model sitting at 35. I believe its rather binary, we either have a pullback of around 5% to 7% or we are going to take out 3,260. I am in the camp we pullback and the market is not trading on any fundamental basis and purely on short term quant systems. The NASDAQ hit an all time high today and if the index does close on the lows today, this will bring in sellers and weaker hands.
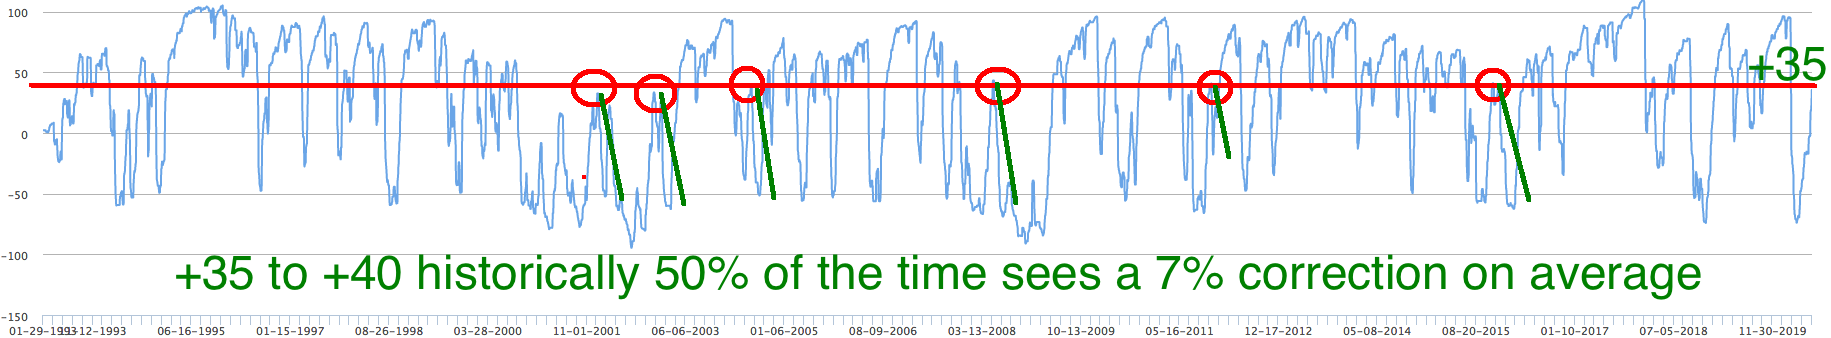
June 3rd
- Today the S&P 500 futures hit 3,129, 3,130/40 which was our target going back a few weeks.
- This rally is now being powered purely from quants and not the Fed. The Fed reduced their daily $70 billion QE purchases to now $4 billion a day. Additionally, their $2.4 trillion credit facility to buy junk credit has only used $350 billion. Their programs were enough to close the credit spreads sparking quants to start getting long.
- Personally, I think this market is beyond overvalued and if we fail and correct it will be at this 3,140 level. If we close above 3,140 on a weekly close, its possible we test 3,260. The only reason I think valuations don’t make a difference in this market is 70% of the trading intraday are machines and their inputs are not looking at fundamental data and strictly trending following technical.
- What I find hysterical is everyone on CNBC is now bullish that price is improving, the only thing that has change is the rate of change of the % return of the equity market.
May 30th
- Nothing has changed from May 23rd. Now the S&P 500 most likely will test the 3,130 level and I do believe we will see a pullback to 2,730.
- As I mentioned in the last post, when the blended S&P 500 model increases from less than -70 to +35/40, the index 50% of the time corrects on average 7%.


May 23rd
Key Points:
- I have been saying for a while now going back to April 29th that 3,000 and a possible overshoot to 3,100 was in the cards. 3,120 would be a 23% Fibonacci retracement level.
- This does not mean in anyway I am long term bullish and certainly do not believe the current economic and unemployment back drop warrants even the current level of 2,950.
- I do believe if the market was to overshoot to 3,100 we will experience a momentum crash over the next few months back to 2,730.
- I also think if we have a hard fail at 3,000 the market will reverse hard. The hard fail would be a 30 to 50 point spike to 3,000 or slightly above and close on the days lows and negative with more than average volume. I rarely look at volume as it is not a good indicator. Take SPY for example, it has been averaging 50 million shares for the last 3 weeks and its 12 month historical average volume is 180 million. There are no sellers and between retail investors and quants the market is so easy to push higher.
- Covid19 has been a once in a century event, which has presented a once in a century market event. In response and a complete game changer to back stop the market, the Fed responded by buying credit and junk bonds. This helped tighten credit spreads to avoid a collapse in equity markets. A complete false positive of the true state of the credit markets.
- I think we can all agree this is not a free market and risk does not really exist and nor do fundamentals. So how do we invest in this environment? That is really tough to answer unfortunately, but as long as you are aware of what is truly driving the market and the potential outcomes this should help guide your decision.
- The blended S&P 500 model is now -2.5, never before has it failed at 0, so I expect once it goes positive more buyers “Quant” will keep buying. While 20, 21, 22 times forward 2021 earnings is total insanity with 25 million unemployed and where many small business will go bankrupt, the fundamental facts wont make a difference. The big variable, how many of these 25 million people will have a job to go back to? GDP is 3/4ths comprised of the consumer, not Facebook, Apple, Google and Amazon, so the recovery of unemployment in my opinion is key. Furthermore, with more than 60% of S&P 500 companies pulling guidance, how can any investor have any visibility into earnings. The one positive that will create pent up demand is that the consumer has been saving significantly during the lock down. This could create a surge in spending with a full reopen.
- Between the low volume coupled with machines being the marginal buyer and buy and hold investors never selling, we can sit here with a completely broken fake market and by end of summer see the S&P 500 flat for the year at 3,300. Is it possible? Maybe.
- Lastly, the blended model is a -2.5, historically if the S&P 500 fails from increasing off a less than -60, the model fails on average +30. This would be about another 3% from 2,950, giving you around 3,050. This is rather a rough estimate, but provides some visibility. Additionally, if the model does fail from +30 off a less than -60 counter trend rally, the average pullback is roughly 7%. which would result in 2,828 on the S&P 500. This obviously is extremely subjective and hypothetical and this move might not be as relevant to historical rallies and correction.
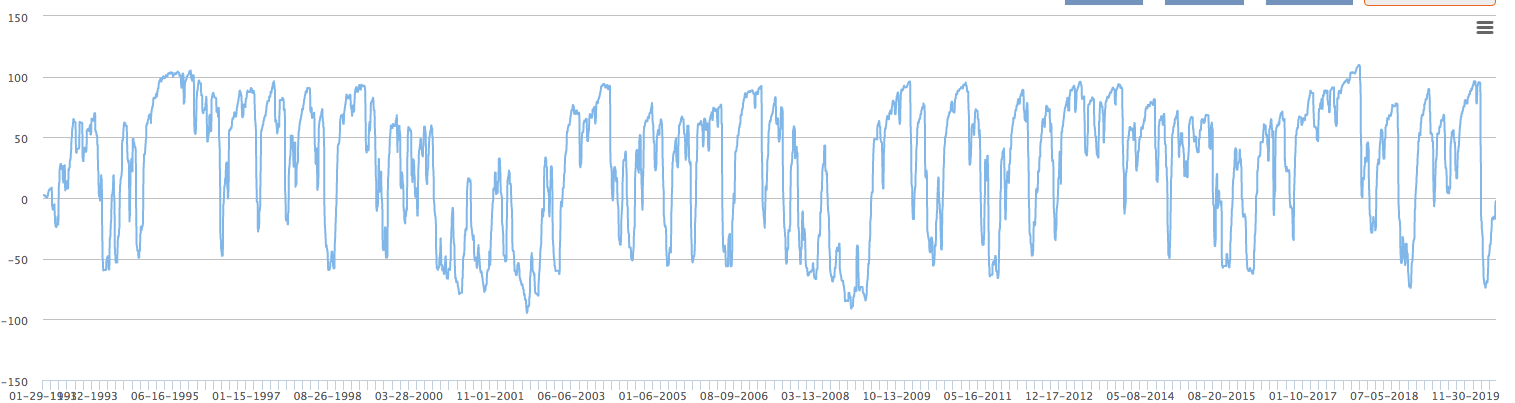
May 20th
Impressive day as the S&P 500 sold off 31 handles yesterday off the back of Moderna news, which should have been a surprised because this information was out the previous day. Regardless, the futures recovered all night taking out resistance on multiple time frames by the quant trend followers.
As we previously stated, 2940 on the S&P 500 futures was a sizable level. I was expecting to see 3,000 a week earlier and now it seems like only a matter of days. 3,000 is the hard part because the trend strength will build significantly and bring in even more quants. I would sell some at 3,000, but I personally need to see what our rating value looks like if and when we do get there. As I mentioned, on April 29th, we could see a overshot to 3,100, if the continues set up for it.
As the rating value keeps gaining in strength below more and more shorts will be squeezed and quants will just keep buying.
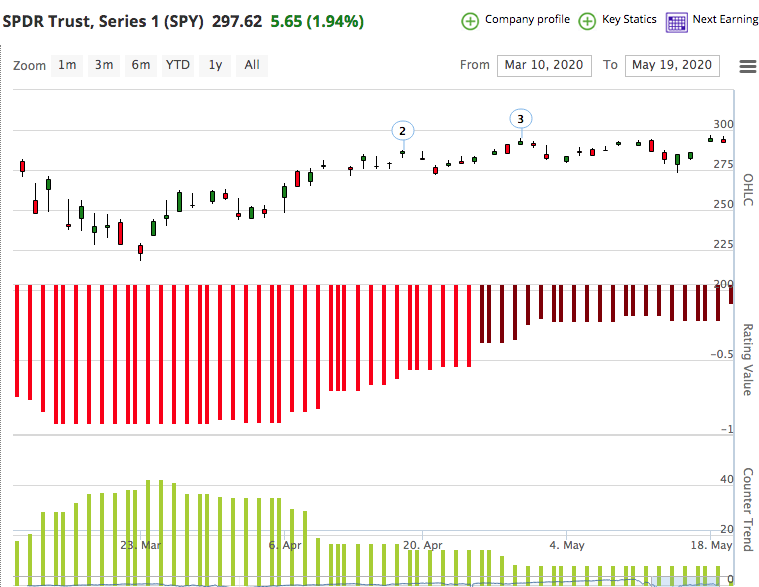
May 16th
Very little to report as the S&P 500 remained extremely resilient close above 2,830. At this juncture, I would be surprised to see another retest of 2888 this week and a close above this level will potentially attempt for a 4th retest of 2940. More tensions with China this week wouldn’t keep the market from close at the lows, which was extremely bullish. Everyone knows that this market is now completely backstopped by the fed, and its purchases of ETFs this week certain lent more support to the index’s.
May 8th
Well the S&P 500 never took out that 2,830 level and buy programs three days later took out 2,888. At his juncture a close above 2,940 will finally take the S&P to our second price target of 3,000. To reconfirm we are sellers. Do I think trend followers will take the market up past 3,000 to 3,100, it certainly is a possibility. Again, as trend strength increases quants will just keep adding to their longs and covering their shorts. We don’t have to be fundamental analysts to know that this market is extremely expensive and that the machines are in control right now. While I was never that bearish though this unfortunate event, I do think 20 times 2021 earnings at the current level is just absurd. However that doesn’t mean we cant trade at 22 times forward earnings either.
I still remain in the belief that the reopening will not be smooth and a V shape recovery is not going to happen. I believe price action will get weaker as the economy reopens. However, the Fed will continue to keep a back stop in the market and I don’t see the S&P 500 breaching 2,630. If we do achieve 3,000, I could imagine a pull back to 2,730 would be bought.
May 1st
Update:
- So we reduced equity exposure at 2900/2930, unfortunately we never tested 3,000 to reduce even more long exposure and it looks like we topped at in the short term at 2,965.
- A close today below 2,830 will start to cause pressure on the market and 2,730 is the next level I would look for.
- As I mentioned this recent 400 point advance in the S&P 500 was purely technical caused by trend following programs, not fundamentals. When companies cant provide guidance who can you even put a multiple on the S&P 500.
- The market caught a massive counter trend rally off a -74 S&P 500 blended reading. Once the trend starts to strengthen all system traders come back into the market and either buy the index or stocks to increase risk. This buying continues as the trend strength increases everyday. However, once this buying stops, and levels are broken the same machines keeping selling.
- This move was nothing more than a swing trade in the index and I still believe at some point we will at least retest the large breakout area of 2,630. I have no idea if we retest the lows, that would be highly dependent upon on how the economy reopens.
April 29th
As I mentioned on April 14th, we were looking for the following levels on the S&P 500:
- Our first level of 2930 was reached today. Futures are up 17 handles trading at 2958 off the back of solid earnings. Reducing some exposure at 2,960 tomorrow is warranted.
- Our second level between 3,000 and 3,030 is our next target to reduce significant exposure.
After hours MSFT and FB had very constructive numbers. MSFT is 5.50% and FB 1.85% of the S&P 500 weight, which should help press the S&P 500 higher tomorrow. I think both of these companies between cloud and online ad business were able to not just tread water but thrive in this lock down. As we know 5 companies in the S&P 500 make up 20% of the S&P 500 market cap and does not give a true picture of the health of the S&P 500.
While I think the market at 3,030 is getting way to ahead of itself, we could overshoot to 3,100 at which point I will be massively reducing long exposure regardless of any events.
Lastly, today’s rally was was sparked by Gilead. While Biotech and healthcare is not my area of expertise, I will say this seems like more of a short covering rally off the news. The treatment is for the most severe cases and not a vaccine.
S&P futures Levels — Click to enlarge
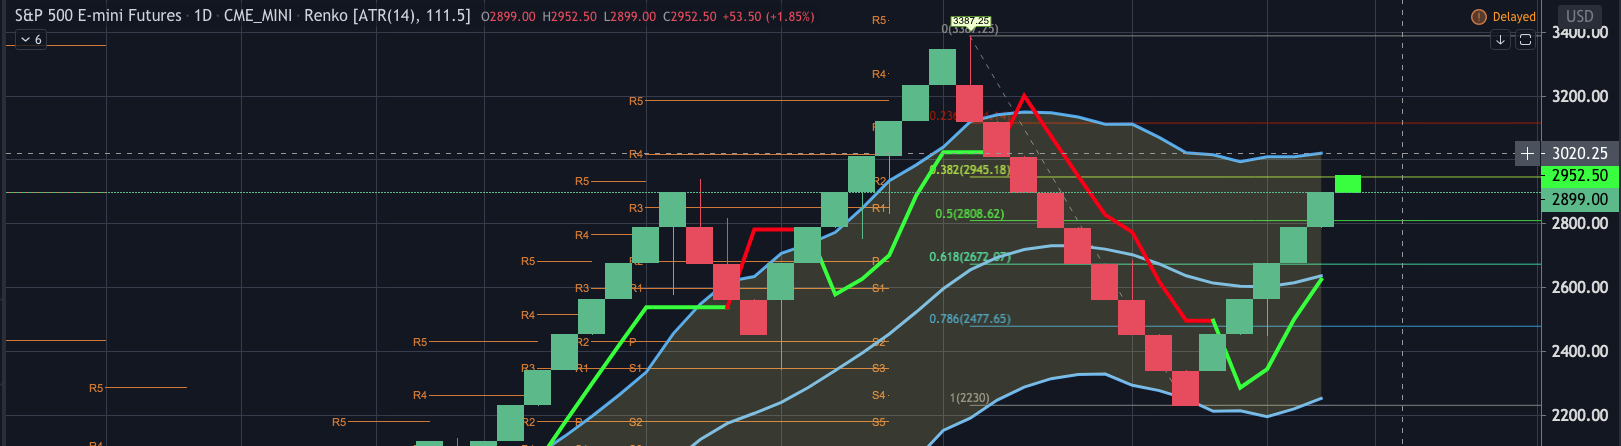
April 27th
There has been no change to my S&P 500 outlook since April 14th. While almost all investors will agree on a fundamental basis the current valuations are much to high, the technicals are controlling the market here. The market is pricing in a reopen of the economy. However, a second wave is the potential real danger. Foe now the April 14th level are sill in effect.
3,030 represents a 62% retracement and the upper band on the keltner channel. I still believe if we test this level a pull back to 2,730 and even 2600 is possible.
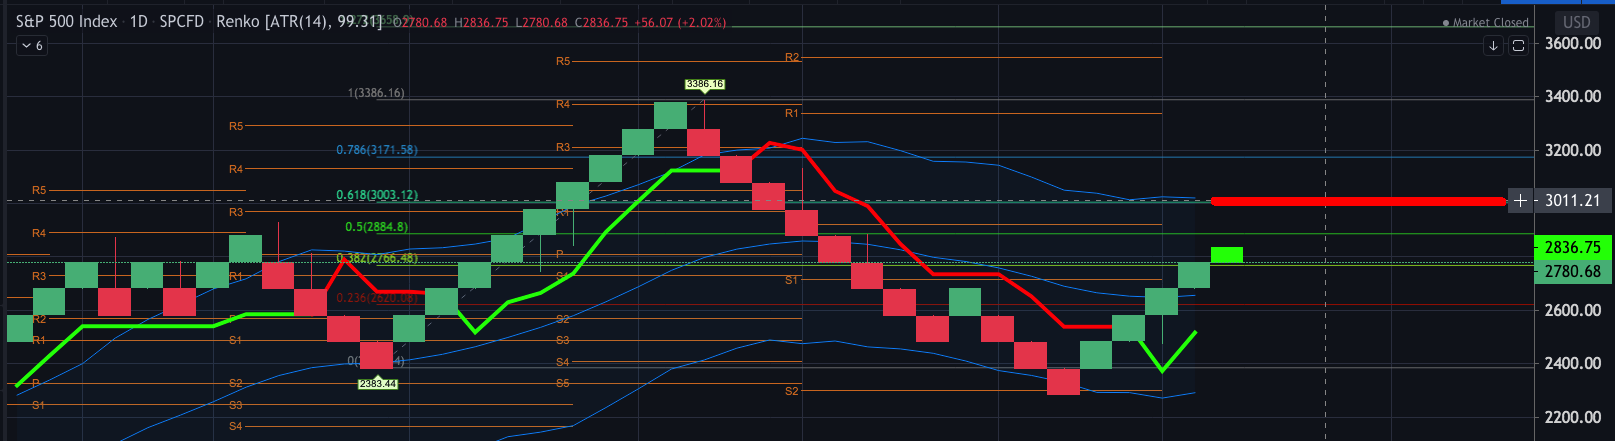
April 14th
As we said last week on April 10th there was a very significant event of the Fed back stopping Junk Credit/Debt. While on a fundamental basis I have a hard time buying anything at these levels, however, I am not a seller yet. On April 8th, I provided a few levels were I would be selling some equities and based on the blended S&P 500 model I am increasing these price targets. As you will recall on April 10th, I said the model historically does not fail after a move from -74 to -45. Therefore, the momentum right or wrong will build here.
- No-longer selling 2,850 and moving this to 2900/2930 level.
- Not selling significant amount of long exposure at the 50 day and waiting to sell into the 3,025.
- As for buying on a pullback… You will only get that large pullback once we over shoot to the upside which is maybe 3,025. Don’t ask what that level is because I haven’t a clue nor does anyone else. It will happen either on a second wave of infections once everyone goes back to work mind summer or companies in the 3rd quarter need to take down numbers again. Until then there is no such thing as true price discovery as the Fed will back stop every market pullback.
- If anyone wants access to me personally on the S&P 500 from 8 am to 6 pm as many times a day, I am available for $500 a month. You can reach me at brett@thechartlab.com