Changing Colors and width for Charts
Example:
Step 1. Go to charts, then indicators.

Step 2. Choose the indicator. Remember under the new charting package ATR Trailing Stops are called Volatility Stops.

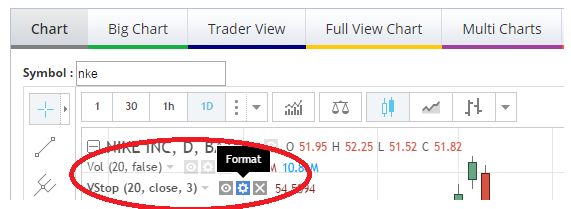
Step 3. Click on the format of the indicator you want to change.

Step 4. Change your inputs and Style based on your personal preference. We like a line for the ATR / Volatility Sop, with a nice thickness.

