Trend Following and how we look at Relative Strength
1. The Technical Trend Score
2. Short Term, Medium and Long Term Trend calculation
Disclaimer: This should not be used as an indicator and only for demonstration purposes.
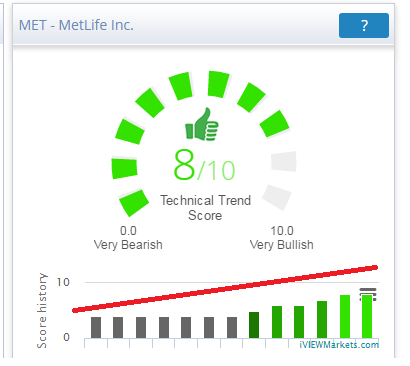
The Technical Trend Score
Weakest rating is a 0, with a 10 being the strongest value in terms of relative strength.
The Technical Trend Score is a very basic and commonly followed technical methodology. The methodology is built around relative strength, which is a price momentum trend following technique. Relative Strength calculates which securities are the strongest performers, compared to an index, sector or other asset classes over a certain look back period. Typically, most practitioners use a 6 or a 12 month period to determine the relative strength. This is often a buy high and sell higher strategy as it assumes a stock whose price is increasing will continue to rise in the near future.
The Technical Trend Score blends the long term, medium and short term trends to calculate the overall technical strength of a security. The long term trend measures the percentage move above the 200 SMA and 150 day rate of change. The medium term trend measures the percentage move above the 150 SMA and the 100 day rate of change. Lastly, the short term trend measures the percentage above the 21 SMA and the MACD. Since the longer term trend is the most important element, the weight applied to the longer term trend is weighted the most followed by the medium term trend and then the short term trend. Securities with the greatest rate of change (ROC) and percentage above the moving averages are considered to have the greatest relative strength. There have been numerous studies showing evidence that stocks that are outperforming on both a relative and absolute basis on a 6 and 12 month look back period tend to outperform on a short term time frame.
The biggest challenge with trend following is when to sell as the strongest stocks are typically the greatest percentage winners on a 6 to 12 month look back period. This can cause many investors to chase the best performing stocks. This hording (crowded trade) effect leaves stocks vulnerable to mean reverting price action when the trend breaks. Trend followers will want to watch for overbought levels to reduce exposure to lock in gains and avoid possible corrections. There are a number of ways to determine overbought levels, the most common indicator is RSI, however; it typically will not allow longer term investors to remain in a stock for larger price moves.
Again, the Technical Trend Score is not a trade signal and should not be used as a trading strategy or for market timing. It’s is designed to give a snapshot of all known pricing information in the security at that point in time within the market. Remember, technical analysis cannot forecast future price moves and should be used in conjunction with stocks that have sound fundamentals.
Short Term, Medium and Long Term Trend calculation
iVIEWMarkets short, medium and long term trend bars are calculated as seen below.


