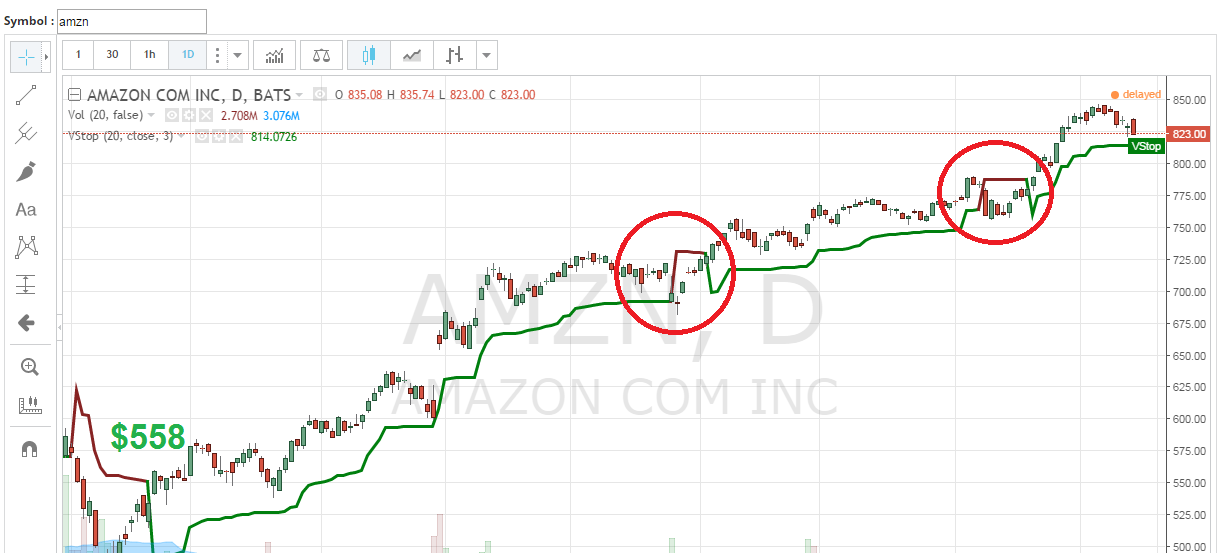
Today we wanted to discuss another tool that you might find of value in your investment process. This indicator is a common, but really good one called the Volatility Stop or ATR Trailing Buy/Stop, or a volatility stop. Similar to Average True Range (ATR), this applies a multiplier, typically over a five- to 20-day time period. Short-term traders will want to move closer to a five-day period, and longer-term investors should start with 20 days or even use a weekly chart.
To me, the multiplier is really the more important data input to manage downside volatility. Each investor obviously will have a different risk tolerance when it comes to downside volatility. The lower the multiplier, the sooner a volatility stop will trigger and exit from the position. I typically try and keep it simple using a multiplier of three and 20 days.
While no indicator can either forecast price moves or work in all environments, I like this one to mitigate risk and even manage new entry points. Let me also stress, I have done extensive backtesting using this indicator, and there is no perfect time frame or multiplier and purely subjective based on each investors risk level.
The Volatility Stop can be found here.
Two Scenarios
First let us preference that we like using this indicator better with with a Renko or Heinki-Ashi chart to remove more daily price volatility, which gives better price confirmation. Let’s take a look at two different scenarios using the Volatility trailing buys and stops. We are looking at the S&P 500 for short-term traders and intermediate-term investors.
The first chart is a daily Volatility trailing stop/buy of 20 days with a multiplier of 2. We can see red and green line on the chart. The red line represents the Volatility trailing stop and green the Volatility trailing buys.
As seen in the first chart below, on June 30, 2016, the S&P 500 moved back above the Volatility trailing buy (green line) around 2,070. Conversely, we can see the S&P 500 closed below the Volatility trailing stop (red dots) on Sept. 9, 2016 aroind 2,150. This Volatility trailing stop configuration might work well for those traders with a one- to six-month time frame.
The second chart is a weekly Renko chart using a Volatility Trailing Stop/Buy of 20 days and a 2 multiplier on a weekly. On February 26th, 2016, the S&P 500 moved back above the Volatility trailing buy (green dots) around 1,962. Since this is obviously a longer duration and will incur more downside volatility, the Volatility trailing stop remains long the S&P 500 and has not generated a sell with eirther the Renko or Trailing Volatility Stop. This Volatility Trailing Stop configuration might work well for those traders with a six-month to greater than one-year time frame.


