By now you will know how important it is to have a robust technical signal that will provide confirmation of strong trends to avoid whipsaw price action. As you know we like Renko Charts to avoid daily price volatility. We wanted to discuss another chart style that can be helpful as well. While we have found Renko to reduce more noise than Heikin-Ashi, Heikin-Ashi tend to move a little more quickly for buys and sells.
What is Heikin-Ashi
Heikin-Ashi Candlesticks are derived from Japanese candlesticks. Heikin-Ashi Candlesticks use the open-close data from the prior period and the open-high-low-close data from the current period to create a combo candlestick. The resulting candlestick filters out some noise in an effort to better capture the trend. With all the back testing we have done, we have never found any evidence that candle stick patterns provide high probability signals for long term buy or sell signal. However, we do believe Heikin-Ashi candles are good for reducing price noise better than traditional candles.
There is never a perfect world, while Renko might be slower the confirmation seems to be greater than Heikin-Ashi. Either way, you might enjoy trying this style with both parabolicsar and the volatility stop (ATR Trailing Stops)
Traditional Candles, Heikin-Ashi Candles and Renko
- The first chart is a traditional candlestick chart with an ATR of AMZN, which generated two Sell Stops since breaking out at $558
- The second chart Heikin-Ashi chart with less daily volatility did not product any volatility stops
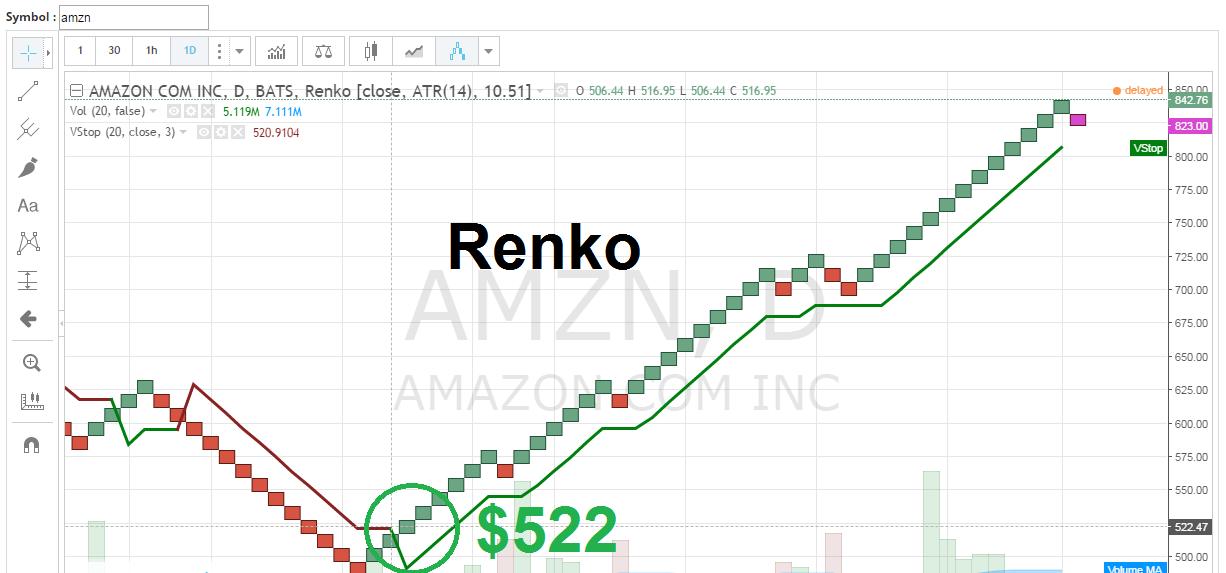
- The last chart is using Renko, providing the least amount of noise.


