Do you want an investment edge?
If you are using the same information as the crowd you have no edge. Learn how to apply our models for the following:
- Buid a repeatable 5 minute trend following process.
- Quickly Identify sector rotaion.
- Quickly locate trend following buying opportunities.
- Learn when to buy and sell based on our process.
- Learn what technical to avoid for maximum trend following gains.
- Bonus, enter your email for periodic special discounts.
The Growing challenge of democratized data and efficient markets
Investors today have access to faster and cheaper investment data than ever before. This democratization of information is making financial markets trade more efficiently than any time in history.
Having access to the same data and indicators is making it extremely difficult for investors to generate alpha. This is because investors are not diversifying away from the crowded commonly followed data sets and indicators.
Our Edge
ChartLabPro provides unique trend following price series models that reduce price momentum volatility. By reducing price momentum, it allows for greater confirmation of price trends and price exhaustion. This is what we call “robust confirmation of price”. This robustness allows our trend models to remain in a trade for the greatest price appreciation until price is fully exhausted or price failure. This helps mitigate crowded trades and avoid momentum crashes, as well as, diversifies away from commonly followed momentum indicators.
To out-perform the crowd, investors need to look at data differently and diversify away from traditional indicators or commonly followed indicators.
Let’s take a look at an example of our models below
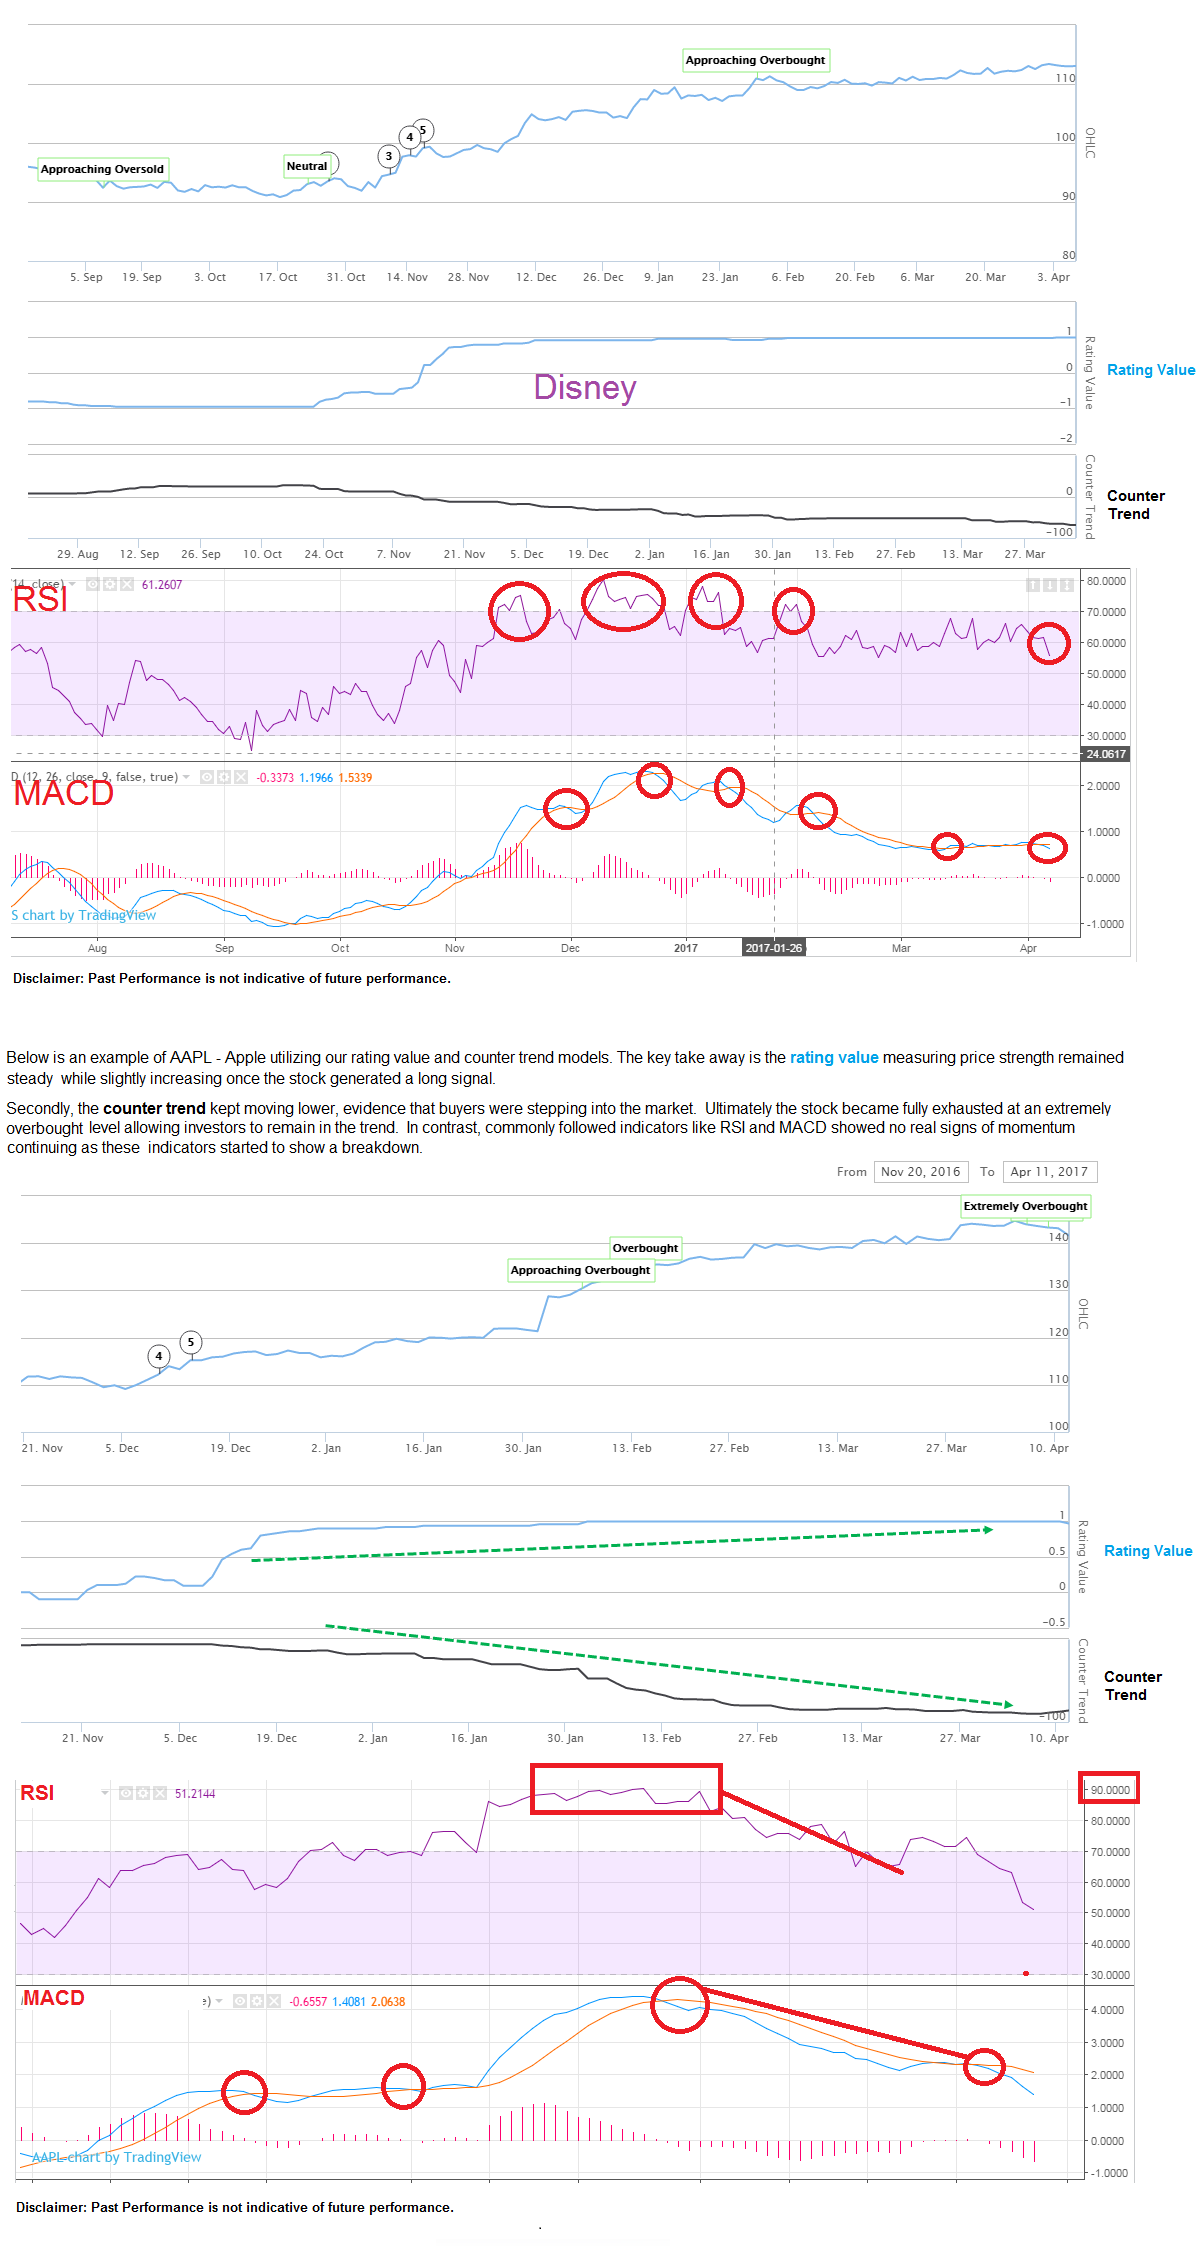
Below is a chart of DIS – Disney. The first line is the price series of the stock. The two lines below the price is our rating value model (measuring trend strength) and our counter trend model (measuring trend exhaustion). You will notice how robust the models are in their ability to remove daily price volatility… they are smooth and steady. This helps investors to maximize their return on capital and gain a greater level of conviction to remain in the trade or investment.
Once the rating value reaches its maximum trend strength, investors will want to focus on the counter trend. The counter trend will help investors to determine when the trend is fully exhausted and to reduce exposure and look for greater potential opportunities. The counter trend helps mitigate downside volatility and momentum crashes that are commonly associated with momentum based strategies. This is an important element of our risk management for trades ranging from 60 to 300 days.
Commonly Followed Indicators = No Edge
In the same example of Disney below, we have two commonly followed indicators: RSI and MACD. As you can see, both of these are full of price noise and volatility. These indicators do not paint a clear direction for investors in terms of price strength or price exhaustion. These commonly followed technical indicators cause many false signals (as you can see below represented in the red circles). These false signals create that whipsaw in-and-out behavior that doesn’t allow technical traders to experience full appreciation.
See Video on How to use our model